
Specialty Gas Market Size, Share Global Analysis Report, 2023-2032
REPORT DETAILS
REPORT DETAILS
ABOUT THIS REPORT
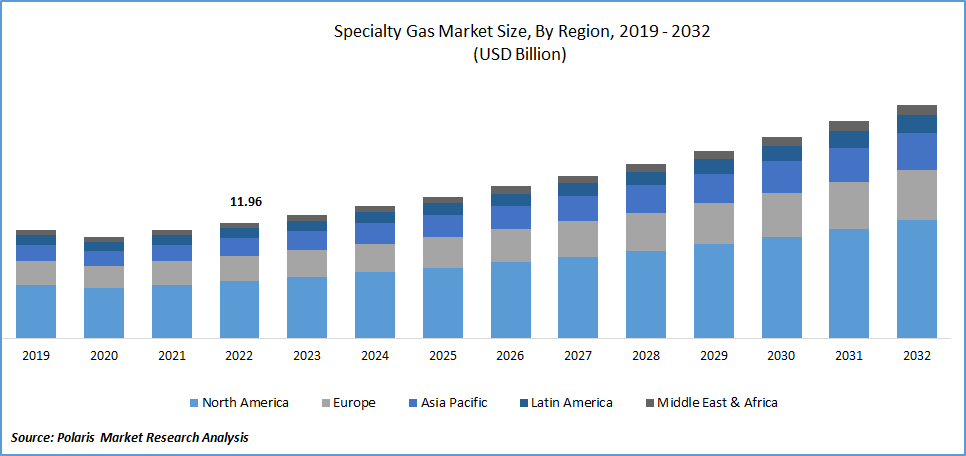
The global Specialty Gas market was valued at USD 11.96 billion in 2022 and is expected to grow at a CAGR of 7.3% during the forecast period.
The market is experiencing substantial growth due to its increasing adoption in various electronics, manufacturing, and healthcare sectors. The expansion of markets for semiconductors and displays is a major driving force behind the rising demand for specialty gases in electronics applications. As technology advances and the need for more sophisticated electronic devices increases, specialty gases are crucial for semiconductor manufacturing and display fabrication.
Product innovations, technological advancements, and the introduction of regulatory policies have been detailed in the report to enable businesses to make more informed decisions. Furthermore, the impact of the COVID-19 pandemic on the Specialty Gas market demand has been examined in the study. The report is a must-read for anyone looking to develop effective strategies and stay ahead of the curve.
To Understand More About this Research: Download Sample Report
Additionally, the growing healthcare industry and advancements in clinical treatments are contributing to the market's growth. Specialty gases, including diagnostics, therapies, and laboratory research, are vital in medical applications. The need for accurate and reliable gas mixtures for medical devices and procedures fuels the demand for specialty gases in healthcare.
Moreover, the specialty gas industry serves diverse sectors such as petrochemical, oil & gas, analytical research, and consumer electronics. These industries require specific gas formulations, leading to sustained demand for specialty gases.
The COVID-19 pandemic had a negative impact on the market. The disruptions caused by the pandemic led to supply chain disruptions across various industries, including petrochemicals, oil & gas, consumer electronics, and manufacturing. With many countries implementing lockdown measures and restrictions, manufacturing operations were severely affected, resulting in reduced output levels and lower demand for specialty gases. The slowdown in industrial activities and the overall economic uncertainty caused by the pandemic had a detrimental effect on the specialty gas market, creating challenges for suppliers and manufacturers.
For Specific Research Requirements, Request Customization
Industry Dynamics
Growth Drivers
The market is experiencing a significant boost in demand from the electronics industry. This surge in demand can be attributed to several factors. Firstly, rapid technological advancements and the increasing demand for electronic devices such as smartphones, tablets, and wearable gadgets drive the need for specialty gases in semiconductors and display manufacturing processes.
Specialty gases play an important role in semiconductor fabrication, including deposition, etching, and cleaning. These gases are used to create precise and controlled environments necessary for producing high-performance microchips and electronic components.
Furthermore, the growing trend of miniaturization and the development of advanced electronic devices with higher functionality require more complex manufacturing techniques. Specialty gases are utilized in various precision applications, such as lithography and thin film deposition, to achieve the desired performance and quality standards.
Additionally, the increasing adoption of technologies like 5G, the Internet of Things (IoT), and artificial intelligence (AI) drives the demand for specialty gases in the electronics industry. These technologies require advanced semiconductor devices and displays, fueling the need for specialty gases in their production.
Report Segmentation
The market is primarily segmented based on product, application, and region.
| By Product | By Application | By Region |
|
|
|
To Understand the Scope of this Report: Request Customization
The carbon gases segment held the largest revenue share in 2022
In 2022, the carbon gases segment held the largest revenue share in the market, and it is projected to maintain its dominant position throughout the forecast period. Carbon gases find extensive use in medical equipment like magnetic resonance imaging, nuclear magnetic resonance imaging, ophthalmology, and others. The demand for carbon gases is also high in industries such as electronics, manufacturing, healthcare, and chemicals.
The increasing application scope of carbon gases in instrument calibration drives the demand for these gases. Moreover, the high-purity gases segment is anticipated to exhibit the highest CAGR during the forecast period. High-purity gases are utilized for insulation, lighting, and cooling purposes in various industries, including electronics, metal processing, chemicals, and oil & gas. They play an important role in semiconductor manufacturing as well. With the expansion of the semiconductor industry, the demand for high-purity gases is expected to rise significantly.
The healthcare segment held the largest revenue share in 2022
In 2022, the healthcare segment held the largest revenue share in the market, and it is projected to maintain its dominant position throughout the forecast period. The healthcare industry relies on various specialty gases, including oxygen, medical air, medical nitrous oxide, and medical helium. These gases are essential for multiple medical applications and procedures.
The continuous growth of the healthcare sector, coupled with increased healthcare expenditure by governments worldwide, is expected to be a significant driver for the specialty gas market. The utilization of advanced medical technologies that require specialty gases also contributes to the market's growth. As governments invest in improving healthcare infrastructure and facilities, the demand for specialty gases in the healthcare sector will likely continue expanding.
Asia Pacific is expected to have significant growth over the forecast period
The Asia-Pacific region is expected to experience rapid growth in the market due to its high consumption in electronics, automotive, and healthcare industries. Fueled by increasing disposable incomes and demand for electronic products, the electronics sector is witnessing the highest growth rates in consumer electronics. China's electronics manufacturing businesses reported a significant year-on-year profit increase of 38.9% in 2021, contributing to the market's positive outlook.
Moreover, Japan's electronics sector, encompassing devices, components, and consumer/industrial equipment, witnessed a production value surge of nearly 10% to approximately USD 100 billion in 2021, as per the Japan Electronics and Information Technology Industries Association (JEITIA). This growth further supports the expansion of the specialty gas market in the region.
Furthermore, the automotive segment's expansion in China is expected to drive the demand for specialty gas. China, the largest producer of automobiles, manufactured a staggering 26,082,220 vehicles in 2021, according to the International Organization of Motor Vehicle Manufacturers (OICA). This robust automotive industry is another catalyst for the specialty gas market's growth in Asia-Pacific.
Competitive Insight
Some of the major players operating in the global market include:
- Air Liquide
- Coregas
- Air Products and Chemicals Inc.
- Iwatani Corporation of America
- MESA Specialty Gases & Equipment
- Linde plc
- Messer Group GmbH
- Norco Inc.
- YUEYANG KAIMEITE ELECTRONIC AND SPECLALTY RARE GASES CO.
- Mitsui Chemicals Inc.
- SHOWA DENKO K.K.
- ILMO Products Company
- Taiyo Nippon Sanso Corporation
- Weldstar Inc
Recent Developments
- In April 2025, Linde plc announced plans to expand specialty gas supplies to Samsung Electronics’ advanced semiconductor facility in Pyeongtaek, South Korea, reinforcing its position in the high-purity gases market.
- In February 2025, Merck KGaA and Linde plc announced plans to establish specialty chemicals and gases facilities in India to support the country’s growing semiconductor manufacturing ecosystem.
- In February 2023, Linde will construct and operate an on-site complex in Beaumont, Texas, supplying OCI's new blue ammonia facility with clean hydrogen and nitrogen, sequestering 1.7 million tons of CO2 emissions annually.
- In February 2023, Air Products introduced the PRISM InertPro Nitrogen Membrane System at the Middle East Oil and Gas Show, offering a flexible modular platform with cutting-edge technology for efficient nitrogen applications in the industry.
Specialty Gas Market Report Scope
| Report Attributes | Details |
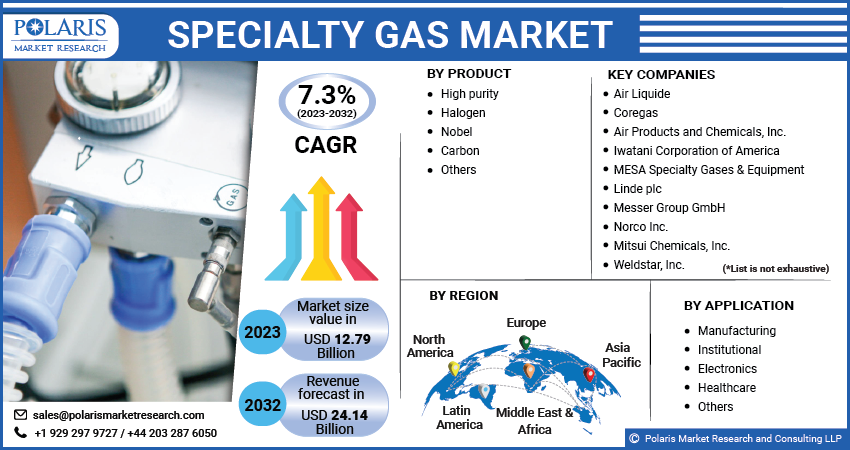
| Market size value in 2023 | USD 12.79 billion |
| Revenue forecast in 2032 | USD 24.14 billion |
| CAGR | 7.3% from 2023 – 2032 |
| Base year | 2022 |
| Historical data | 2019 – 2021 |
| Forecast period | 2023 – 2032 |
| Quantitative units | Revenue in USD billion and CAGR from 2023 to 2032 |
| Segments Covered | By Product, By Application, By Region |
| Regional scope | North America, Europe, Asia Pacific, Latin America; Middle East & Africa |
| Key Companies | Air Liquide, Coregas, Air Products and Chemicals, Inc., Iwatani Corporation of America, MESA Specialty Gases & Equipment, Linde plc, Messer Group GmbH, Norco Inc., YUEYANG KAIMEITE ELECTRONIC AND SPECLALTY RARE GASES CO., Mitsui Chemicals, Inc., SHOWA DENKO K.K., ILMO Products Company, Taiyo Nippon Sanso Corporation, Weldstar, Inc. |
We strive to offer our clients the finest in market research with the most reliable and accurate research findings. We use industry-standard methodologies to offer a comprehensive and authentic analysis of the Specialty Gas market. Besides, we have stringent data-quality checks in place to enable data-driven decision-making for you.
FAQ's
The Specialty Gas Market report covering key are product, application, and region.
Specialty Gas Market Size Worth $ 24.14 Billion By 2032.
The global Specialty Gas market is expected to grow at a CAGR of 7.3% during the forecast period.
Asia Pacific is Specialty Gas Market.
key driving factors in Specialty Gas Market are Growing Demand from Electronics Industry.
Research Methodology
A robust system of research, verification, and forecasting designed to ensure reliable and actionable market insights.
Polaris Market Research & Consulting, Inc. uses a clear and structured approach to deliver insights that clients can rely on. The process combines detailed primary and secondary research, including direct communication with industry experts. The detailed information helps build a complete picture of market trends and developments. Secondary data is gathered from credible sources such as industry reports, company filings, government source links, and trusted organization databases. It is then cross-checked through discussions with key stakeholders across the value chain. Market size and forecasts are developed using both bottom-up and top-down methods to ensure accuracy and consistency in the final results.
1. Project Setup
Step 1 & 2:
- We start every project by clearly understanding the client’s objective or goal, then defining the market scope, and aligning regions, segments, and timelines.
- Once the foundation is set, we collect data from all-around of sources, including company reports, government databases, and paid industry platforms.
- Our research is based on secondary data, which helps us build a strong understanding of the market across regions and industries. Then we validate this information through primary research by speaking directly with industry experts, companies, and stakeholders.
- By combining secondary and primary research, we ensure that our market insights are accurate, practical, and closely aligned with real market conditions.
2. Data Collection
We gather information from both public and verified sources:
3. Data Structuring
Step 3:
- All collected data is organized into a consistent format to ensure accurate analysis. Since inputs come from multiple sources, they are standardized and aligned before use.
- The data is segmented by product, application, and region, and mapped across a defined historical period (2020–2024). All values are converted into common units (USD Mn/Bn), and volume and pricing are aligned where required to estimate revenue.
- Any overlaps or inconsistencies are reviewed and adjusted to maintain accuracy (<5% variance threshold).
- The result is a structured dataset that allows for clear comparison across regions and supports reliable analysis and forecasting.
Structured Market Dataset, USD Mn/Bn
| Region | Segment | VolumeUnits | Avg PriceUSD | RevenueUSD Mn | Share % |
|---|---|---|---|---|---|
| North America | Product A | 250 | 2.5 | 500 | 15% |
| Product A | XX | XX | XX | XX | |
| Product A | XX | XX | XX | XX | |
| Consistent methodology applied across regions | |||||
4. Market Estimation
Step 4: TOP-DOWN APPROACH
- We start with the overall market size at a global or macro level.
- The market is then narrowed down based on scope and industry relevance.
- We apply penetration rates and split the data by region and segment.
- This helps us estimate the market size for specific segments.
- The numbers are validated through cross-checks to ensure accuracy.
Step 5: BOTTOM-UP APPROACH
- We begin by analyzing data from leading companies in the market.
- Revenue data is collected and mapped across different segments.
- The data is then aggregated to estimate the total market size.
- To fill in any gaps, adjustments are made based on industry standards.
- Validation checks make sure that the results are correct.
5. Forecasting
Step 6:
At Polaris Market Research & Consulting, Inc., we employ a methodical forecasting strategy. This approach blends the analysis of historical data with real-time market validation. To forecast future trends with precision, we examine past patterns, pricing fluctuations, and the interplay of supply and demand. To ensure our conclusions reflect the present market landscape, we actively seek input from industry experts and key stakeholders.
To refine our predictions, we carefully consider critical elements such as market drivers and restraints, fluctuations in raw material costs, emerging technologies, and the production capabilities of various regions. Furthermore, we assess regulatory frameworks and potential policy shifts to gauge their potential impact on market expansion.
All this information is synthesized to generate precise forecasts for each segment and region. These forecasts illuminate the current state of the market and highlight forthcoming opportunities.
6. Validation & Triangulation
Step 7:
In the final stage, we validate all our estimates using a triangulation method, where data is cross-checked from multiple reliable sources, like company data, primary interviews, and secondary research. This helps us make sure that our numbers are correct and fit with the rest of the market.
This process involves verifying data consistency across various segments and geographic areas. It also requires comparing historical trends with the assumptions support the forecast. Any discrepancies involve adjustments to ensure everything remains aligned and dependable.
Once the data is finalized, we prepare the final outputs, including market size estimates, segment-wise breakdowns, and growth metrics. These are delivered in structured formats such as tables, charts, and data files for easy analysis and use.
We collaborate closely with clients, ensuring the final products align with their requirements. This includes offering tailored adjustments, supplementary data analyses, and continuous assistance. Furthermore, we monitor market trends post-delivery, providing updates and refinements to maintain the insights' relevance as time passes.
Triangulation Framework
Estimates are cross-verified across three sources:
Company-level data
• Primary inputs from industry participants
• Secondary benchmarks and published data
Variance maintained within +5-10%
Adjustments applied to align estimates
Segment values validated against overall market structure
Data Consistency & Integrity
Segment totals validated to 100%
Regional estimates aligned with global market size
Historical trends compared against forecast outputs
Assumptions reviewed for cross-segment and regional alignment
Final Outputs
Deliverables
Client Alignment & Support
- Deliverables are aligned with defined client requirements and scope
- Custom data cuts and segment splits are incorporated as required
- Post-delivery queries are addressed through analyst interactions
- Additional clarifications and data support are provided upon request
Client Continuity & Updates
- Market developments are tracked post-delivery to capture changes in key trends
- Updated data and revisions are provided based on new market inputs
- Additional refinements and data cuts are shared as required
- Continued analyst engagement supports evolving client requirements
Download Sample Report of Specialty Gas Market
Please fill out the form to request a customized copy of the research report.
