
Reports

Global Sensitive Toothpaste Market Size, Share Analysis Report, 2023-2032
REPORT DETAILS
REPORT DETAILS
ABOUT THIS REPORT
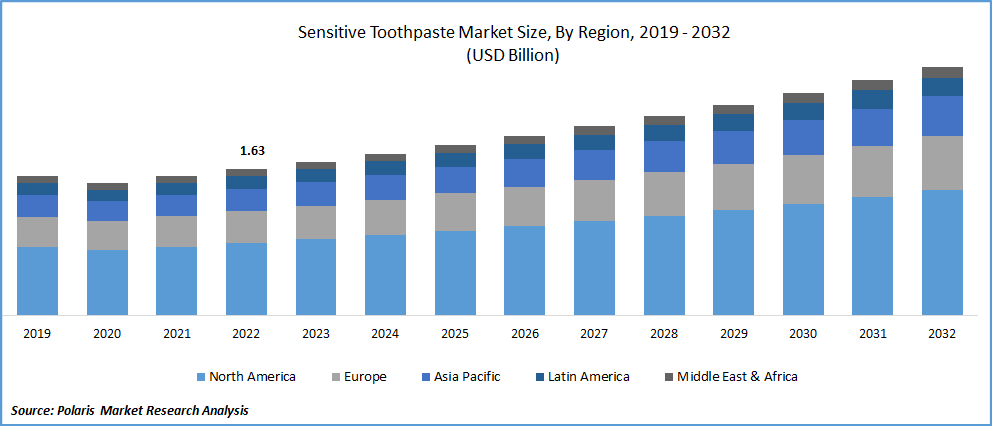
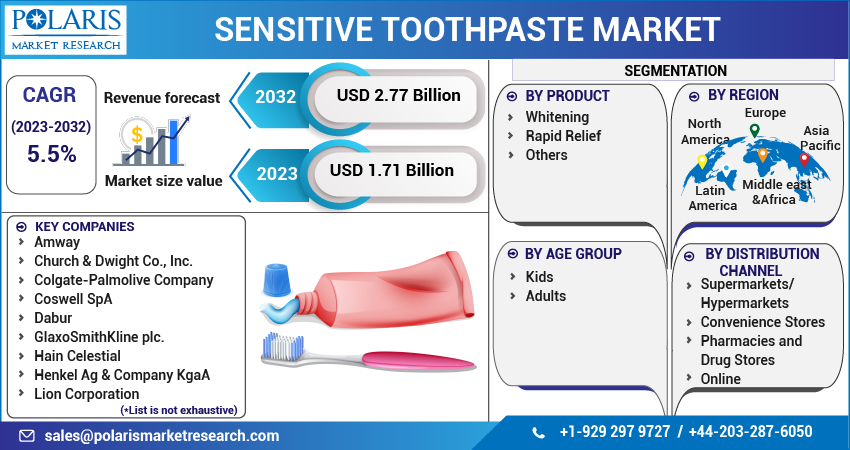
The global sensitive toothpaste market was valued at USD 1.63 billion in 2022 and is expected to grow at a CAGR of 5.5% during the forecast period.
The global market for sensitive toothpaste is experiencing growth due to a combination of factors, including frequent product advancements, increasing awareness of dental issues, and a rise in cases of dental caries. Additionally, the market is being driven by changes in lifestyle and an increase in the adoption of tobacco and alcohol, which have led to a greater need for sensitive toothpaste.
Know more about this report: Download Sample Report
Sensitive toothpaste is a type of toothpaste that is designed to prevent tooth sensitivity and provide a refreshing breath. It is typically used to treat oral sensitivity that results from exposed dentine. Oral sensitivity can cause short, sharp pain when eating or drinking, indicating underlying dental issues such as recessed gums, cavities, or weakened enamel. Sensitive toothpaste helps to alleviate this pain by forming a protective layer over the sensitive area.
Furthermore, Increased awareness of personal health and dental hygiene has resulted in a growing demand for organic toothpaste for treating tooth sensitivity. Using natural and organic products in the beauty and personal care market is rising. Consumers increasingly seek organic oral care products to prevent dental issues such as tooth decay and oral or throat cancer. Some sensitive toothpaste options contain harmful ingredients, leading to a greater demand for natural and organic toothpaste from peppermint, coconut oil, herbs, and minerals.
The COVID-19 pandemic has had a mixed impact on the market. There has been an increased focus on personal hygiene and health during the pandemic, leading to a rise in demand for oral care products, including sensitive toothpaste. However, supply chains have been disrupted due to restrictions on transportation and manufacturing activities, leading to shortages of raw materials and delayed production. Additionally, economic uncertainties and reduced consumer spending power have affected the overall sales of oral care products, including sensitive toothpaste. The market will likely face challenges and opportunities as the pandemic evolves.
For Specific Research Requirements, Download Sample Report
Industry Dynamics
Growth Drivers
The increasing prevalence of dental problems, rising consumer awareness, and advancements in product formulations are growing the sensitive toothpaste market. Dental problems such as tooth decay, gum recession, and enamel erosion are becoming more common, leading to a greater need for preventative measures such as sensitive toothpaste. The rising awareness among consumers about the benefits of using sensitive toothpaste for oral care is also driving demand. Moreover, with ongoing technological advancements and ingredient formulations, manufacturers are developing more innovative and effective products to cater to the increasing demand.
Increasing disposable income as disposable income levels rise, consumers are more likely to invest in high-quality oral care products, including sensitive toothpaste. In addition, the growing demand for natural and organic products in the personal care market is driving demand for sensitive toothpaste made from natural ingredients. Consumers are becoming increasingly conscious about using chemicals daily and are turning towards organic alternatives, which is expected to boost the demand for sensitive toothpaste from natural ingredients.
Furthermore, the aging population is expected to contribute significantly to the growth of the market. As the population ages, there is a higher prevalence of dental issues and a greater need for oral care products such as sensitive toothpaste. The older demographic is more aware of the benefits of using oral care products and is more likely to invest in high-quality products. With the increasing prevalence of dental problems, the aging population is expected to drive demand for sensitive toothpaste as a preventative measure for maintaining oral health.
Report Segmentation
The market is primarily segmented based on product, age group, distribution channel, and region.
| By Product | By Age Group | By Distribution Channel | By Region |
|
|
|
|
Know more about this report: Download Sample Report
Whitening Segment Accounted for the Highest Revenue Shares in 2022
The whitening segment holds the highest revenue shares in the market. This trend is expected to continue in the upcoming years due to the numerous benefits whitening toothpaste offers. These benefits include calming the tooth's nerves, guarding against damage caused by dietary acid erosion, and lightening stains on teeth. As a result, the whitening segment is expected to experience positive growth.
The rapid relief segment is expected to witness the highest CAGR. This is because fast relief sensitive toothpaste relieves sensitivity to pain in just a few minutes, protecting teeth from decay and providing refreshing breath. Including potassium nitrate, fluoride, Penta-sodium Triphosphate, and stannous fluoride create a protective layer on exposed dentin, which aids in providing quick relief to sensitive areas. These benefits are expected to drive the growth of the rapid relief segment in the coming years.
Adult Segment Dominated the Market in 2022
The adult segment dominated the market and is anticipated to experience substantial growth at a notable CAGR throughout the projected period. This segment encompasses individuals aged 15 years and above and toothpaste products containing various chemicals, including fluoride and other substances. These chemicals are sought after by consumers for purposes such as teeth whitening, gum, and enamel care, cavity and tooth decay prevention, and bacteria elimination. Additionally, a wide range of toothpaste options are available in the market to cater to the growing consumer demand.
Supermarkets/Hypermarkets Segment Dominated the Market
The supermarkets/hypermarkets segment dominated the market, which offers easy access to a wide range of products. Furthermore, the growth of the medical sector and increased recommendations of toothpaste by dental professionals may also contribute to the segment's expansion. Additionally, a growing awareness of dental care and tooth sensitivity among the population further fuels segment growth, ultimately driving the overall development of the sensitive toothpaste industry.
The online segment is expected to grow rapidly in the coming years. This is attributed to factors such as the growing preference for E-commerce sites and the availability of various offers and discounts. Moreover, the increasing number of working professionals who prefer online shopping due to its convenience and time-saving benefits are significant factors that will drive the demand for this segment and contribute to the overall growth of the market.
North America Dominated the Global Market in 2022
North America dominated the market with the largest market share. Vendors in the region are using various marketing strategies to increase demand, and the adoption of alcohol contributes to this growth. The region's rising disposable income and health awareness are also factors.
The Asia Pacific region is expected to have the highest CAGR in the global sensitive toothpaste market. This is due to the rising demand for dental care products, particularly in India and China, where a significant portion of the population suffers from sensitivity and dental issues. Many oral care products in India are made from Ayurvedic and natural substances. The Chinese government supports dental care through policies that promote oral hygiene and cover dental clinics and hospitals. These factors are expected to drive the region's demand for sensitive gel dentifrice.
Competitive Insight
Some of the major players operating in the global sensitive toothpaste market include
- Amway
- Church & Dwight Co.
- Colgate-Palmolive Company
- Coswell SpA
- Dabur
- GlaxoSmithKline plc.
- Hain Celestial
- Henkel Ag & Company KgaA
- Lion Corporation
- Procter & Gamble
- Science Arts (Yunnan Baiyao)
- SQUIGLE
- Sunstar Suisse S.A.
- Tom's of Maine
- Unilever.
Recent Developments
- In February 2025, Zion Health expanded its oral care portfolio with the launch of Claybrite Sensitive Toothpaste, a fluoride-free, clay-based formulation specifically designed for oncology patients experiencing mouth sores. This product addresses a niche yet growing demand for gentle, therapeutic oral care solutions tailored to medically sensitive users.
- In January 2025, Haleon strengthened its premium toothpaste segment by introducing Sensodyne Clinical Repair Deep Clean and Sensodyne Clinical Repair Active White. Both variants are powered by NovaMin technology, offering enhanced enamel repair and sensitivity relief. Notably, these products are packaged in fully recyclable HDPE tubes, aligning with the company’s sustainability and eco-friendly packaging initiatives.
- In June 2024, Haleon expanded its international footprint by rolling out Sensodyne Clinical White across eight countries. Additionally, the company launched parodontax Gum Strengthen & Protect in Italy, reinforcing its focus on periodontal health and preventive gum care.
- In March 2023, TePe introduced a new range of specialized toothpaste solutions targeting individuals with specific oral hygiene challenges. The launch included TePe Daily and TePe Pure, both formulated to support users suffering from dry mouth conditions and sensitive gums, further diversifying offerings in the sensitive oral care segment.
- In April 2022, GSK Consumer Healthcare has unveiled Sensodyne® Nourish, a new range of toothpaste designed to fortify and nourish teeth with bio-active minerals for a healthy, sensitivity-free mouth.
Sensitive Toothpaste Market Report Scope
| Report Attributes | Details |
| Market size value in 2023 | USD 1.71 billion |
| Revenue forecast in 2032 | USD 2.77 billion |
| CAGR | 5.5% from 2023 – 2032 |
| Base year | 2022 |
| Historical data | 2019 – 2021 |
| Forecast period | 2023 – 2032 |
| Quantitative units | Revenue in USD billion and CAGR from 2023 to 2032 |
| Segments Covered | By Product, By Age Group, By Distribution Channel, By Region |
| Regional scope | North America, Europe, Asia Pacific, Latin America, Middle East & Africa |
| Key Companies | Amway, Church & Dwight Co., Inc., Colgate-Palmolive Company, Coswell SpA, Dabur, GlaxoSmithKline plc., Hain Celestial, Henkel Ag & Company KgaA, Lion Corporation, Procter & Gamble, Science Arts (Yunnan Baiyao), SQUIGLE, Inc., Sunstar Suisse S.A., Tom's of Maine, Inc., and Unilever |
FAQ's
Key companies in sensitive toothpaste market are Amway, Church & Dwight Co., Inc., Colgate-Palmolive Company, Coswell SpA, Dabur, GlaxoSmithKline plc., Hain Celestial, Henkel Ag & Company KgaA.
The global sensitive toothpaste market expected to grow at a CAGR of 5.5% during the forecast period.
The sensitive toothpaste market report covering key segments are product, age group, distribution channel, and region.
Key driving factors in sensitive toothpaste market are increasing prevalence of dental problems.
The global sensitive toothpaste market size is expected to reach USD 2.77 billion by 2032.
Sensitive toothpaste types include Whitening (largest segment), Rapid Relief (fastest-growing), and Others featuring natural, organic, and specialized enamel-strengthening formulations.
Asia Pacific shows highest growth due to large populations with dental sensitivity in India and China, rising incomes, and government support for dental care.
Research Methodology
A robust system of research, verification, and forecasting designed to ensure reliable and actionable market insights.
Polaris Market Research & Consulting, Inc. uses a clear and structured approach to deliver insights that clients can rely on. The process combines detailed primary and secondary research, including direct communication with industry experts. The detailed information helps build a complete picture of market trends and developments. Secondary data is gathered from credible sources such as industry reports, company filings, government source links, and trusted organization databases. It is then cross-checked through discussions with key stakeholders across the value chain. Market size and forecasts are developed using both bottom-up and top-down methods to ensure accuracy and consistency in the final results.
1. Project Setup
Step 1 & 2:
- We start every project by clearly understanding the client’s objective or goal, then defining the market scope, and aligning regions, segments, and timelines.
- Once the foundation is set, we collect data from all-around of sources, including company reports, government databases, and paid industry platforms.
- Our research is based on secondary data, which helps us build a strong understanding of the market across regions and industries. Then we validate this information through primary research by speaking directly with industry experts, companies, and stakeholders.
- By combining secondary and primary research, we ensure that our market insights are accurate, practical, and closely aligned with real market conditions.
2. Data Collection
We gather information from both public and verified sources:
3. Data Structuring
Step 3:
- All collected data is organized into a consistent format to ensure accurate analysis. Since inputs come from multiple sources, they are standardized and aligned before use.
- The data is segmented by product, application, and region, and mapped across a defined historical period (2020–2024). All values are converted into common units (USD Mn/Bn), and volume and pricing are aligned where required to estimate revenue.
- Any overlaps or inconsistencies are reviewed and adjusted to maintain accuracy (<5% variance threshold).
- The result is a structured dataset that allows for clear comparison across regions and supports reliable analysis and forecasting.
Structured Market Dataset, USD Mn/Bn
| Region | Segment | VolumeUnits | Avg PriceUSD | RevenueUSD Mn | Share % |
|---|---|---|---|---|---|
| North America | Product A | 250 | 2.5 | 500 | 15% |
| Product A | XX | XX | XX | XX | |
| Product A | XX | XX | XX | XX | |
| Consistent methodology applied across regions | |||||
4. Market Estimation
Step 4: TOP-DOWN APPROACH
- We start with the overall market size at a global or macro level.
- The market is then narrowed down based on scope and industry relevance.
- We apply penetration rates and split the data by region and segment.
- This helps us estimate the market size for specific segments.
- The numbers are validated through cross-checks to ensure accuracy.
Step 5: BOTTOM-UP APPROACH
- We begin by analyzing data from leading companies in the market.
- Revenue data is collected and mapped across different segments.
- The data is then aggregated to estimate the total market size.
- To fill in any gaps, adjustments are made based on industry standards.
- Validation checks make sure that the results are correct.
5. Forecasting
Step 6:
At Polaris Market Research & Consulting, Inc., we employ a methodical forecasting strategy. This approach blends the analysis of historical data with real-time market validation. To forecast future trends with precision, we examine past patterns, pricing fluctuations, and the interplay of supply and demand. To ensure our conclusions reflect the present market landscape, we actively seek input from industry experts and key stakeholders.
To refine our predictions, we carefully consider critical elements such as market drivers and restraints, fluctuations in raw material costs, emerging technologies, and the production capabilities of various regions. Furthermore, we assess regulatory frameworks and potential policy shifts to gauge their potential impact on market expansion.
All this information is synthesized to generate precise forecasts for each segment and region. These forecasts illuminate the current state of the market and highlight forthcoming opportunities.
6. Validation & Triangulation
Step 7:
In the final stage, we validate all our estimates using a triangulation method, where data is cross-checked from multiple reliable sources, like company data, primary interviews, and secondary research. This helps us make sure that our numbers are correct and fit with the rest of the market.
This process involves verifying data consistency across various segments and geographic areas. It also requires comparing historical trends with the assumptions support the forecast. Any discrepancies involve adjustments to ensure everything remains aligned and dependable.
Once the data is finalized, we prepare the final outputs, including market size estimates, segment-wise breakdowns, and growth metrics. These are delivered in structured formats such as tables, charts, and data files for easy analysis and use.
We collaborate closely with clients, ensuring the final products align with their requirements. This includes offering tailored adjustments, supplementary data analyses, and continuous assistance. Furthermore, we monitor market trends post-delivery, providing updates and refinements to maintain the insights' relevance as time passes.
Triangulation Framework
Estimates are cross-verified across three sources:
Company-level data
• Primary inputs from industry participants
• Secondary benchmarks and published data
Variance maintained within +5-10%
Adjustments applied to align estimates
Segment values validated against overall market structure
Data Consistency & Integrity
Segment totals validated to 100%
Regional estimates aligned with global market size
Historical trends compared against forecast outputs
Assumptions reviewed for cross-segment and regional alignment
Final Outputs
Deliverables
Client Alignment & Support
- Deliverables are aligned with defined client requirements and scope
- Custom data cuts and segment splits are incorporated as required
- Post-delivery queries are addressed through analyst interactions
- Additional clarifications and data support are provided upon request
Client Continuity & Updates
- Market developments are tracked post-delivery to capture changes in key trends
- Updated data and revisions are provided based on new market inputs
- Additional refinements and data cuts are shared as required
- Continued analyst engagement supports evolving client requirements
Download Sample Report of Sensitive Toothpaste Market
Please fill out the form to request a customized copy of the research report.
