
Reports

Healthcare Payer Services Market Size & Share Global Analysis Report, 2026-2034
REPORT DETAILS
REPORT DETAILS
ABOUT THIS REPORT
Healthcare Payer Service Market Overview
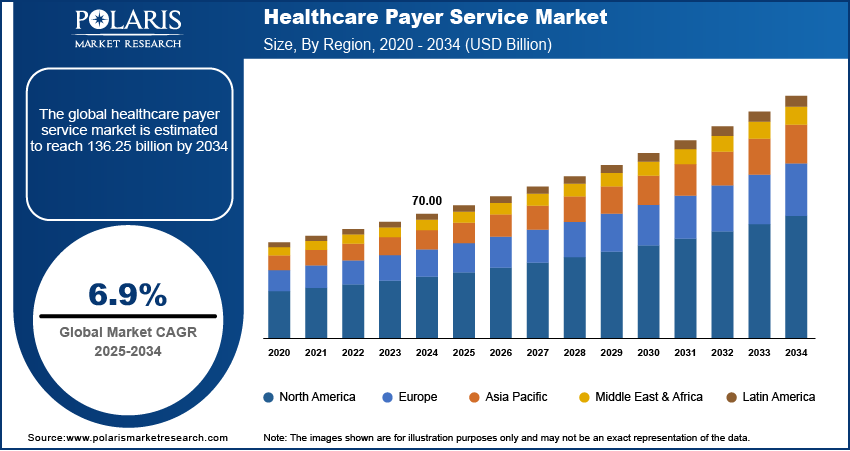
The global healthcare payer service market was valued at USD 74.6 billion in 2025, growing at a CAGR of 7.0% during the forecast period. Rising regulatory complexities, increased healthcare funding, and growing demand for operational efficiency through outsourcing drive the market.
Market Statistics
Key Takeaways
- Regionally, North America held the largest share of the market in 2025, accounting 49.80% market share. This is supported by the presence of major payers and active regulations working toward better healthcare access and equity.
- Asia Pacific region is expected to witness the fastest growth, with a projected CAGR of 7.5%. This growth is mainly due to higher healthcare spending and more people getting insurance.
- In 2025, the BPO services segment accounted for the largest share of 57.59%. This dominance is due to the fact that payers are reelancing to handle complicated and time-consuming tasks like processing claims, managing members, and billing. In this way, they can lower costs, work more efficiently, and concentrate more on the most important parts of healthcare.
- Public payers segment is expected to grow aster at a CAGR of about 7.3% over the forecast period. This is because governments are spending more on healthcare and are emphasiing greater on digitizing claims management and reimbursement processes.
*Note: Figures and projections outlined in this report are the result of Polaris Market Research’s proprietary analytical processes, grounded in the latest available datasets and market observations.
Industry Dynamics
- Cybersecurity concerns and audit pressures are pushing insurers toward outsourcing to reduce risk, ensure continuity, and enhance claims efficiency.
- Limited in-house technical expertise and integration hurdles may delay payer adoption of third-party compliance and data management services.
- Rising healthcare spending is increasing claims volume, prompting insurers to outsource fraud detection, reimbursement tracking, and operational support.
- AI-enabled claims automation and anomaly detection offer scope to reduce payment errors, optimize turnaround, and strengthen fraud management.
- High implementation and maintenance costs of outsourced tech services can limit adoption among smaller payer organizations with tight budgets.
AI Impact on Healthcare Payer Services Market
- Enhances claims processing speed and accuracy through automation, reducing administrative burden and human error.
- Enables predictive analytics for fraud detection, cost forecasting, and member risk stratification.
- Supports personalized member communication via AI chatbots and virtual assistants, improving engagement and satisfaction.
- Streamlines compliance by automating documentation and regulatory reporting workflows.
- Facilitates real-time decision-making through advanced data analytics and machine learning integration.
To Understand More About this Research: Download Sample Report
What are Healthcare Payer Services?
Healthcare payer services include outsourced solutions that help health insurance companies, government agencies, and other payers manage claims, communicate with members, and handle administrative tasks efficiently. The market is growing because of increasing regulatory requirements and operational challenges. Strict government rules, such as data security laws and system updates, require payers to invest in technology and compliance. For instance, in January 2024, the CMS introduced a rule to improve healthcare information sharing and reduce paperwork for treatment approvals. Insurance companies must update their systems by early 2026 to make patient care access easier. These regulations have increased workloads for payers, leading them to seek expert services to handle compliance and operations effectively, boosting the growth of the healthcare payer services market.
The rising cases of healthcare funds, suppoerted by government-sponsored schemes and private investments, have further influenced the healthcare payer service market. A December 2024 report by CMS indicated that US healthcare spending increased by 7.5 percent in 2023, totaling USD 4.9 trillion or USD 14,570 per person. Health spending represented 17.6 percent of the nation's Gross Domestic Product. The surge in funding has resulted in a higher volume of claims processing, fraud detection, anomaly detection, and payment integrity tasks, necessitating advanced solutions to streamline operations. Payer organizations must adapt to manage administrative complexities while ensuring cost efficiency as healthcare systems continue to expand with increased financial backing. Consequently, outsourcing payer services has emerged as a strategic approach to handle increasing financial transactions, regulatory compliance, and data-driven decision-making in a rapidly evolving healthcare landscape.
Market Dynamics
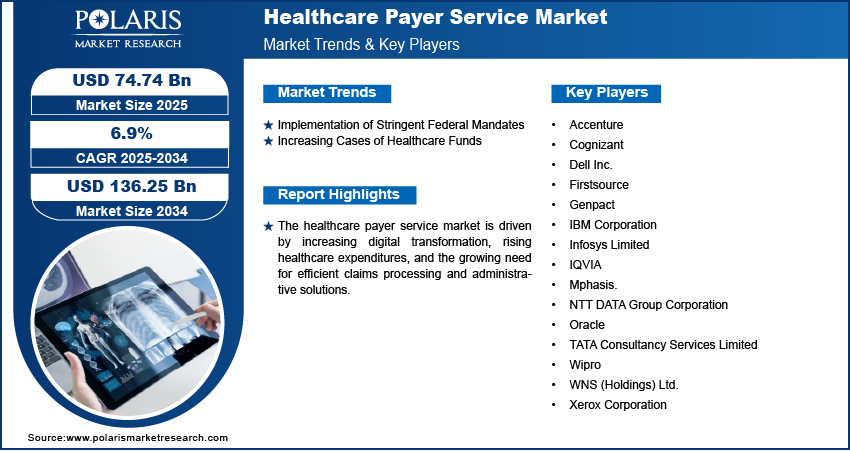
Implementation of Stringent Federal Mandates
Regulatory frameworks, such as data privacy laws, interoperability requirements, and value-based care models, require payers to enhance compliance mechanisms while managing complex administrative processes. For instance, in March 2024, the Centers for Medicare & Medicaid Services (CMS) launched the Change Healthcare/Optum Payment Disruption (CHOPD) program to help Part A providers and Part B suppliers affected by a cyberattack on change healthcare. The program allows eligible providers to request accelerated payments for up to 30 days’ worth of claims, which will be recouped over 90 days from future Medicare claims. These mandates impose strict reporting, auditing, and claims management requirements, leading to a surge in operational complexities. As a result, payer organizations seek external service providers to streamline compliance, optimize resource allocation, and ensure regulatory adherence. The growing burden of federal policies has, therefore, reinforced the need for efficient and scalable payer service solutions.
Increasing Cases of Healthcare Funds
The expansion of government-sponsored healthcare programs, private investments, and employer-funded insurance plans has led to a rise in claim submissions, fraud prevention measures, and reimbursement processes. For instance, in March 2024, UnitedHealth Group made progress in addressing the impacts of a major cyberattack on Change Healthcare that occurred in February 2024. The company advanced over USD 2 billion to assist affected providers and has begun restoring services, including medical claims preparation software. The influx of funds necessitates robust administrative support to prevent inefficiencies, ensure accurate payments, and maintain financial transparency. Payer service providers offer technology-driven solutions to handle these complexities, enabling insurers and healthcare organizations to enhance operational efficiency while managing the financial aspects of patient care.
Segment Analysis
Assessment by Service
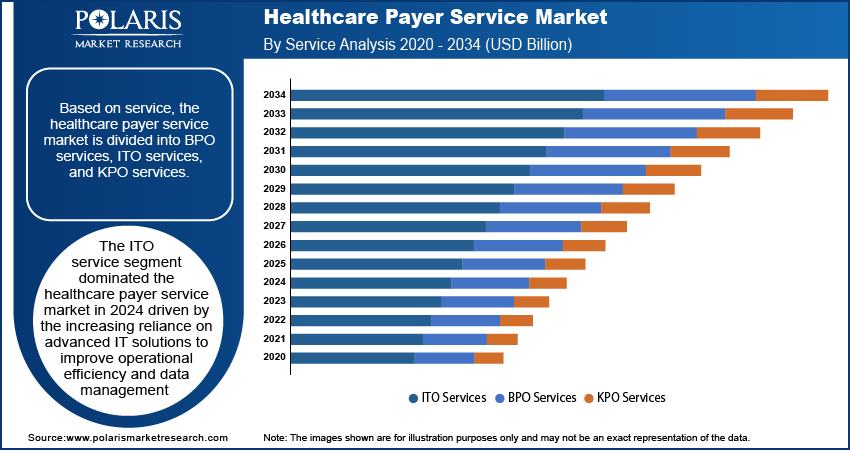
The global healthcare payer service market segmentation, based on service, includes BPO services, ITO services, and KPO services. The ITO services segment dominated the market in 2025 driven by the increasing reliance on advanced IT solutions to improve operational efficiency and data management. Payers are investing in cloud computing, cybersecurity, and AI-driven analytics to streamline claims processing, fraud detection, and regulatory compliance. The growing adoption of electronic health records (EHRs) and digital payment systems has further accelerated the demand for ITO services, enabling seamless data integration and interoperability. Additionally, the rising complexity of healthcare regulations and the need for scalable IT infrastructure have reinforced the dominance of ITO services in transforming payer operations and optimizing administrative workflows.
Evaluation by End Use
The global healthcare payer service market is segmented by end use into private payers and public payers. The public payers segment is expected to witness the highest healthcare payer service market growth during the forecast period due to increasing government initiatives aimed at expanding healthcare coverage and improving reimbursement models. Public healthcare programs are focusing on enhancing efficiency through digital transformation and outsourcing payer services with rising healthcare expenditures and an aging population. The demand for cost-effective solutions in claims management, member enrollment, and compliance tracking is driving public payers to adopt advanced healthcare payer services. Additionally, the integration of AI-driven analytics and automation in public health insurance programs is further accelerating market growth, enabling efficient service delivery and improved patient access to care.
Regional Insights
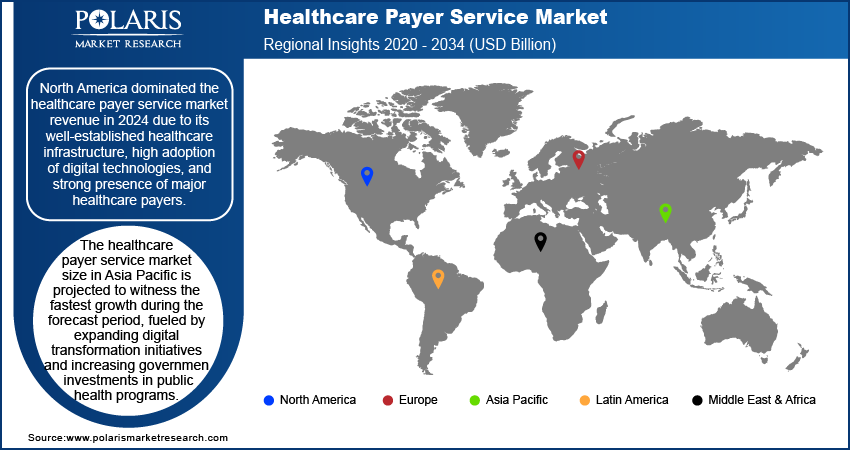
By region, the report provides the healthcare payer service market insights into North America, Europe, Asia Pacific, Latin America, and the Middle East & Africa. North America dominated the market in 2025 due to its well-established healthcare infrastructure, high adoption of digital technologies, and strong presence of major healthcare payers. For instance, in March 2024, the Centers for Medicare & Medicaid Services (CMS) announced its FY 2024 budget, focusing on advancing health equity and improving health outcomes for over 160 million Americans. Key initiatives include enhancing mental health services and implementing measures from the Affordable Care Act and the Inflation Reduction Act to lower healthcare costs and improve access to treatments. CMS aims to provide high-quality health benefits through innovation and technology. The region’s focus on optimizing administrative processes, improving patient engagement, and reducing operational costs has driven investments in payer services, particularly in IT outsourcing and business process management. Regulatory frameworks supporting value-based care and data security compliance have further propelled healthcare payer service market growth. Additionally, the increasing shift toward cloud-based payer solutions and AI-driven analytics has strengthened North America’s leadership in the market, ensuring efficient claims processing and enhanced healthcare delivery.
The healthcare payer service market in Asia Pacific is projected to witness the fastest growth during the forecast period, fueled by expanding digital transformation initiatives and increasing government investments in public health programs. For instance, in December 2024, the Ministry of Health urged states to raise their health budgets by 10% annually. The DoHFW budget increased to USD 101.1 million in 2024-25, while the 15th Finance Commission allocated USD 8.09 billion in health grants to local governments. This substantial investment demonstrates the growing emphasis on strengthening healthcare infrastructure and digital capabilities across regions, setting a benchmark for global healthcare payer service market development. Additionally, the growing penetration of private health insurance providers, coupled with the increasing focus on cost containment and operational efficiency, is further accelerating market expansion. Therefore, as healthcare systems in the region continue to evolve, the demand for advanced payer service solutions is expected to rise, positioning Asia Pacific as a key growth hub in the global market.
Key Market Players & Competitive Analysis Report
The competitive landscape combines global leaders and regional players competing to capture healthcare payer service market share through innovation, strategic alliances, and regional expansion. Global players such as UnitedHealth Group (Optum), Accenture, Cognizant, and others leverage robust technological capabilities and extensive service networks to deliver advanced claims processing, member engagement solutions, and data analytics tools. The market trends indicate rising demand for solutions such as AI-driven fraud detection and cloud-based platforms, including interoperability solutions, reflecting advancements in digital healthcare and administrative efficiency.
The market is projected to grow rapidly, driven by increasing healthcare costs, regulatory compliance requirements, and the need for operational optimization. Regional companies capitalize on localized needs by offering cost-effective and tailored services, especially in emerging markets such as Asia Pacific, which is anticipated to grow at the highest CAGR. The competitive strategies include mergers and acquisitions, partnerships with healthcare technology providers, and the introduction of innovative digital solutions to address the growing need for efficient claims processing and enhanced member experience. A few key major players are Accenture; Cognizant; Dell Inc.; Firstsource; Genpact; IBM Corporation; Infosys Limited; IQVIA; Mphasis; NTT DATA Group Corporation; Oracle; TATA Consultancy Services Limited; Wipro; WNS (Holdings) Ltd.; and Xerox Corporation.
IQVIA provides healthcare payer services and offers innovative solutions designed to enhance efficiency and improve patient outcomes. Their health insurance management platform integrates patients, providers, and payers, facilitating seamless communication and transaction processing while adhering to regulatory standards. This platform enables healthcare organizations to manage claims effectively and optimize the patient journey through real-time data analytics and operational support. Additionally, IQVIA's payer analytics solutions empower payers with actionable insights derived from extensive market data, enabling informed decision-making regarding formulary strategies and member engagement. IQVIA helps payers identify cost-saving opportunities and improve healthcare delivery by leveraging advanced analytics, ultimately driving better health outcomes and competitive differentiation in the evolving healthcare landscape. Through these services, the company plays a crucial role in transforming how healthcare payers operate, ensuring they remain agile and responsive to market demands.
Mphasis is a global IT solutions provider headquartered in Bengaluru, India, specializing in cloud and cognitive services. It offers tailored payer services that enhance operational efficiency and improve patient experiences within the healthcare sector. Their comprehensive solutions include claims processing, member management, and data analytics, enabling healthcare payers to streamline operations and adapt to regulatory changes effectively. Mphasis employs advanced technologies such as artificial intelligence and machine learning to deliver insights that drive decision-making and optimize healthcare delivery. The company’s Front2Back transformation approach emphasizes a customer-centric model, ensuring that healthcare payers can provide hyper-personalized services to their members. Mphasis is well-positioned to support healthcare organizations in navigating the complexities of the industry while enhancing service quality and operational performance with a strong focus on innovation and domain expertise.
List Of Key Companies
- Accenture
- Cognizant
- Dell Inc.
- Firstsource
- Genpact
- IBM Corporation
- Infosys Limited
- IQVIA
- Mphasis.
- NTT DATA Group Corporation
- Oracle
- TATA Consultancy Services Limited
- Wipro
- WNS (Holdings) Ltd.
- Xerox Corporation
Healthcare Payer Service Industry Developments
March 2026: Innovaccer launched an AI-powered solution that independently code a large share of patient encounters, helping reducing manual effort, improve accuracy, and streamline revenue cycle and payer operations. (Source: innovacer.com)
March 2025: Healthcare AI firm Innovaccer introduced its 360-Degree Gap Closure Solution for health plan payers. This platform is designed to smooth risk adjustment and quality improvement processes. Which further enhances coding accuracy and improve member outcomes by leveraging advanced analytics and integrated workflows. (Source: innovaccer.com)
September 2024: Talkdesk, Inc. launched the Talkdesk Healthcare Experience Cloud for Payers, a contact center solution tailored to the customer experience needs of healthcare insurance organizations. (Source: talkdesk.com)
June 2024: Cognizant launched healthcare large language model (LLM) solutions on Google Cloud's generative AI technology, including the Vertex AI platform and Gemini models, to improve administrative processes and user experiences. (Source: cognizant.com)
Healthcare Payer Service Market Segmentation
By Service Outlook (Revenue, USD Billion, 2021 - 2034)
- BPO Services
- ITO Services
- KPO Services
By Application Outlook (Revenue, USD Billion, 2021 - 2034)
- Claims Management Services
- Integrated Front Office Service and Back Office Operations
- Member Management Services
- Provider Management Services
- Billing and Accounts Management Services
- Analytics and Fraud Management Services
- HR Services
By End Use Outlook (Revenue, USD Billion, 2021 - 2034)
- Private Payers
- Public Payers
By Regional Outlook (Revenue, USD Billion, 2021 - 2034)
- North America
- US
- Canada
- Europe
- Germany
- France
- UK
- Italy
- Spain
- Netherlands
- Russia
- Rest of Europe
- Asia Pacific
- China
- Japan
- India
- Malaysia
- South Korea
- Indonesia
- Australia
- Vietnam
- Rest of Asia Pacific
- Middle East & Africa
- Saudi Arabia
- UAE
- Israel
- South Africa
- Rest of Middle East & Africa
- Latin America
- Mexico
- Brazil
- Argentina
- Rest of Latin America
Healthcare Payer Service Market Report Scope:
| Report Attributes | Details |
| Market Size Value in 2025 | USD 74.6 billion |
| Market Size Value in 2026 | USD 79.4 billion |
| Revenue Forecast in 2034 | USD 136.0 billion |
| CAGR | 7.0% from 2026 to 2034 |
| Base Year | 2025 |
| Historical Data | 2021– 2024 |
| Forecast Period | 2026 – 2034 |
| Quantitative Units | Revenue in USD Billion and CAGR from 2026 to 2034 |
| Report Coverage | Revenue Forecast, Market Competitive Landscape, Growth Factors, and Industry Trends |
| Segments Covered |
|
| Regional Scope |
|
| Competitive Landscape |
|
| Report Format |
|
| Customization | Report customization as per your requirements with respect to countries, regions, and segmentation. |
FAQ's
The global healthcare payer service market size was valued at USD 74.6 billion in 2025 and is projected to grow to USD 136.0 billion by 2034.
The global market is projected to register a CAGR of 7.0% during the forecast period.
North America dominated the healthcare payer service market revenue in 2025.
Some of the key players in the market are Accenture; Cognizant; Dell Inc.; Firstsource; Genpact; IBM Corporation; Infosys Limited; IQVIA; Mphasis; NTT DATA Group Corporation; Oracle; TATA Consultancy Services Limited; Wipro; WNS (Holdings) Ltd.; and Xerox Corporation.
The ITO service segment dominated the healthcare payer service market in 2025.
Research Methodology
A robust system of research, verification, and forecasting designed to ensure reliable and actionable market insights.
Polaris Market Research & Consulting, Inc. uses a clear and structured approach to deliver insights that clients can rely on. The process combines detailed primary and secondary research, including direct communication with industry experts. The detailed information helps build a complete picture of market trends and developments. Secondary data is gathered from credible sources such as industry reports, company filings, government source links, and trusted organization databases. It is then cross-checked through discussions with key stakeholders across the value chain. Market size and forecasts are developed using both bottom-up and top-down methods to ensure accuracy and consistency in the final results.
1. Project Setup
Step 1 & 2:
- We start every project by clearly understanding the client’s objective or goal, then defining the market scope, and aligning regions, segments, and timelines.
- Once the foundation is set, we collect data from all-around of sources, including company reports, government databases, and paid industry platforms.
- Our research is based on secondary data, which helps us build a strong understanding of the market across regions and industries. Then we validate this information through primary research by speaking directly with industry experts, companies, and stakeholders.
- By combining secondary and primary research, we ensure that our market insights are accurate, practical, and closely aligned with real market conditions.
2. Data Collection
We gather information from both public and verified sources:
3. Data Structuring
Step 3:
- All collected data is organized into a consistent format to ensure accurate analysis. Since inputs come from multiple sources, they are standardized and aligned before use.
- The data is segmented by product, application, and region, and mapped across a defined historical period (2020–2024). All values are converted into common units (USD Mn/Bn), and volume and pricing are aligned where required to estimate revenue.
- Any overlaps or inconsistencies are reviewed and adjusted to maintain accuracy (<5% variance threshold).
- The result is a structured dataset that allows for clear comparison across regions and supports reliable analysis and forecasting.
Structured Market Dataset, USD Mn/Bn
| Region | Segment | VolumeUnits | Avg PriceUSD | RevenueUSD Mn | Share % |
|---|---|---|---|---|---|
| North America | Product A | 250 | 2.5 | 500 | 15% |
| Product A | XX | XX | XX | XX | |
| Product A | XX | XX | XX | XX | |
| Consistent methodology applied across regions | |||||
4. Market Estimation
Step 4: TOP-DOWN APPROACH
- We start with the overall market size at a global or macro level.
- The market is then narrowed down based on scope and industry relevance.
- We apply penetration rates and split the data by region and segment.
- This helps us estimate the market size for specific segments.
- The numbers are validated through cross-checks to ensure accuracy.
Step 5: BOTTOM-UP APPROACH
- We begin by analyzing data from leading companies in the market.
- Revenue data is collected and mapped across different segments.
- The data is then aggregated to estimate the total market size.
- To fill in any gaps, adjustments are made based on industry standards.
- Validation checks make sure that the results are correct.
5. Forecasting
Step 6:
At Polaris Market Research & Consulting, Inc., we employ a methodical forecasting strategy. This approach blends the analysis of historical data with real-time market validation. To forecast future trends with precision, we examine past patterns, pricing fluctuations, and the interplay of supply and demand. To ensure our conclusions reflect the present market landscape, we actively seek input from industry experts and key stakeholders.
To refine our predictions, we carefully consider critical elements such as market drivers and restraints, fluctuations in raw material costs, emerging technologies, and the production capabilities of various regions. Furthermore, we assess regulatory frameworks and potential policy shifts to gauge their potential impact on market expansion.
All this information is synthesized to generate precise forecasts for each segment and region. These forecasts illuminate the current state of the market and highlight forthcoming opportunities.
6. Validation & Triangulation
Step 7:
In the final stage, we validate all our estimates using a triangulation method, where data is cross-checked from multiple reliable sources, like company data, primary interviews, and secondary research. This helps us make sure that our numbers are correct and fit with the rest of the market.
This process involves verifying data consistency across various segments and geographic areas. It also requires comparing historical trends with the assumptions support the forecast. Any discrepancies involve adjustments to ensure everything remains aligned and dependable.
Once the data is finalized, we prepare the final outputs, including market size estimates, segment-wise breakdowns, and growth metrics. These are delivered in structured formats such as tables, charts, and data files for easy analysis and use.
We collaborate closely with clients, ensuring the final products align with their requirements. This includes offering tailored adjustments, supplementary data analyses, and continuous assistance. Furthermore, we monitor market trends post-delivery, providing updates and refinements to maintain the insights' relevance as time passes.
Triangulation Framework
Estimates are cross-verified across three sources:
Company-level data
• Primary inputs from industry participants
• Secondary benchmarks and published data
Variance maintained within +5-10%
Adjustments applied to align estimates
Segment values validated against overall market structure
Data Consistency & Integrity
Segment totals validated to 100%
Regional estimates aligned with global market size
Historical trends compared against forecast outputs
Assumptions reviewed for cross-segment and regional alignment
Final Outputs
Deliverables
Client Alignment & Support
- Deliverables are aligned with defined client requirements and scope
- Custom data cuts and segment splits are incorporated as required
- Post-delivery queries are addressed through analyst interactions
- Additional clarifications and data support are provided upon request
Client Continuity & Updates
- Market developments are tracked post-delivery to capture changes in key trends
- Updated data and revisions are provided based on new market inputs
- Additional refinements and data cuts are shared as required
- Continued analyst engagement supports evolving client requirements
Download Sample Report of Healthcare Payer Services Market
Please fill out the form to request a customized copy of the research report.
