Graph Technology Market Share, Size, Trends, Industry Analysis Report, By Component, By Graph Type, By Database Type, By Analysis Model, By Deployment, By Application, By End Use, By Region, And Segment Forecasts, 2023 - 2032
- Published Date:Dec-2023
- Pages: 114
- Format: PDF
- Report ID: PM4009
- Base Year: 2022
- Historical Data: 2019-2021
Report Outlook
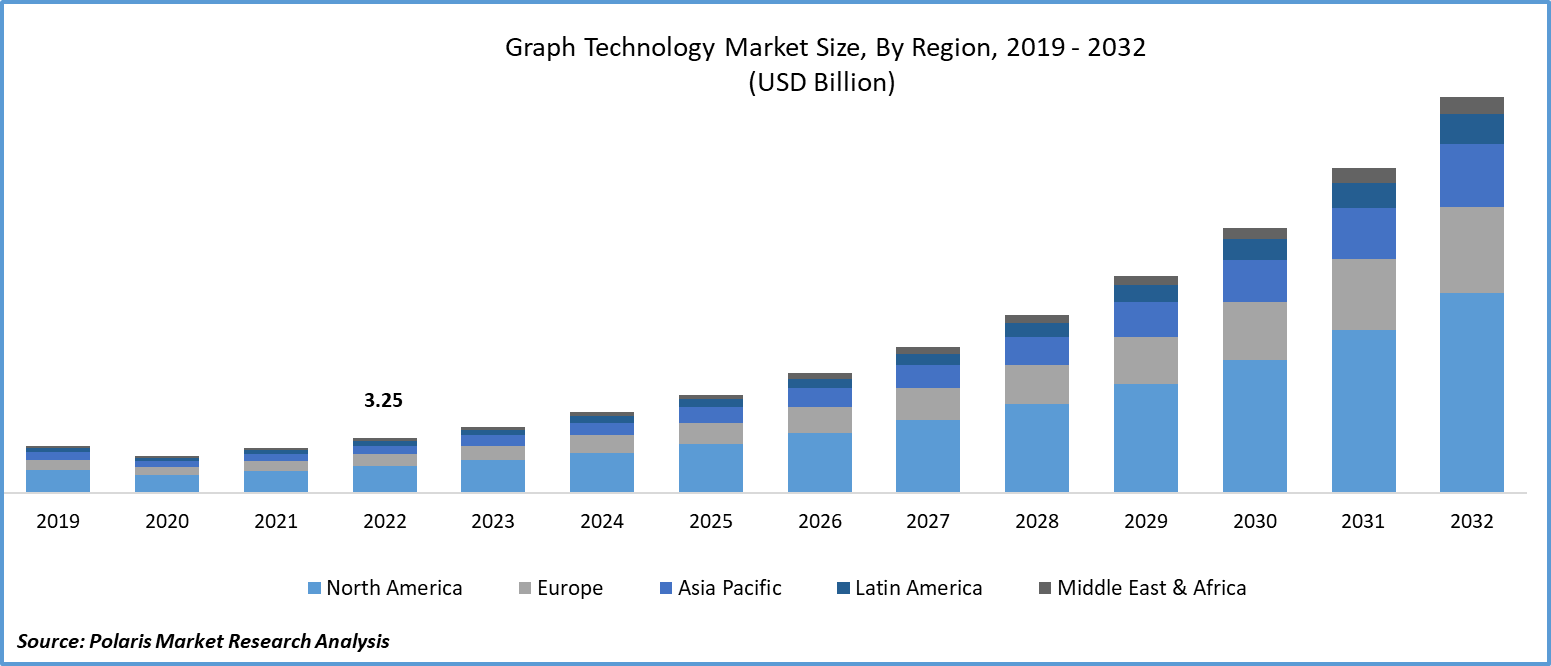
The global graph technology market was valued at USD 3.25 billion in 2022 and is expected to grow at a CAGR of 21.9% during the forecast period.
The market is witnessing significant expansion due to several factors transforming data management practices across diverse industries. This growth is primarily driven by the escalating intricacy of data in the contemporary digital environment. Conventional relational databases face challenges in handling highly interconnected and semi-structured data. In contrast, graph databases shine in this context, enabling organizations to effortlessly model and query relationships between data elements. This feature has resulted in their widespread adoption across sectors, including social media and logistics.

To Understand More About this Research: Request a Free Sample Report
The rapid expansion of the Internet of Things (IoT) has inundated businesses with intricately connected data. Graph databases are exceptionally well-equipped to manage this complexity due to their innate capacity to represent intricate relationships. Sectors like healthcare, logistics, and smart cities are utilizing graph technology to extract meaningful insights from this vast pool of data, transforming it into actionable information. Additionally, the demand for real-time data processing is fueling the adoption of graph technology. These databases excel in handling instantaneous queries and updates, making them essential for applications such as fraud detection, recommendation systems, and social network analysis.
Moreover, industries like finance and healthcare face strict regulatory requirements, necessitating strong data management and privacy protocols. Graph databases offer an effective solution by enabling precise control over data access and relationships. This not only ensures adherence to regulations like GDPR and HIPAA but also elevates overall data security. Additionally, the availability of open-source graph database solutions has played a pivotal role in their widespread adoption. Initiatives like Apache TinkerPop and Neo4j have encouraged innovation and reduced barriers for organizations keen on exploring and integrating graph technology.

For Specific Research Requirements: Request for Customized Report
A notable challenge in the market involves the learning curve related with the graph databases & query languages, which can be relatively steep, especially for organizations accustomed to traditional relational databases. To address this challenge, investment in education and training is essential. Companies can provide extensive training programs to their employees, helping them understand the core concepts of graph databases and effectively use query languages such as Cypher.
Industry Dynamics
Growth Drivers
- Growing Demand for Real-time Data Analysis and Decision Making
The demand for real-time data analysis and decision-making is propelling the growth of the graph technology market. Many applications require instant insights from data to enable proactive responses. Graph databases excel in real-time data analysis by efficiently traversing and querying connected data. Industries such as finance, healthcare, logistics, and cybersecurity leverage graph technology to make immediate, informed decisions and automate processes in response to changing data patterns.
Knowledge graphs have become a key catalyst for market expansion. Businesses now acknowledge the significant benefits of structuring their data, leading to improved decision-making and more efficient data exploration. Leveraging graph technology, these knowledge graphs allow organizations to link diverse data sources, revealing profound insights and enabling informed, data-backed decisions. Moreover, these knowledge graphs not only unveil concealed connections within data but also empower businesses to promptly adapt to shifting market trends and customer needs. Consequently, they have become an essential element in the contemporary data-driven landscape.
Report Segmentation
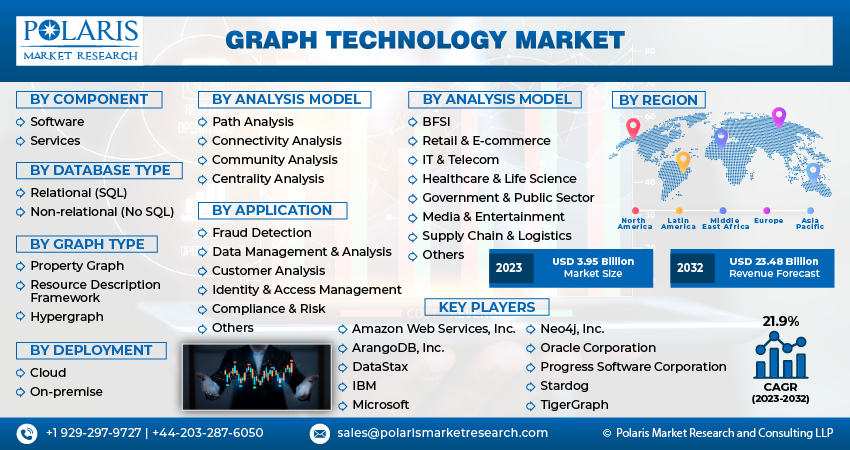
The market is primarily segmented based on component, database type, graph type, analysis model, deployment, application, end use, region.
|
By Component |
By Database Type |
By Graph Type |
By Analysis Model |
By Deployment |
By Application |
By End Use |
By Region |
|
|
|
|
|
|
|
|
To Understand the Scope of this Report: Speak to Analyst
By Component Analysis
- Software segment accounted for the largest share in 2022
Software segment held the largest share. This dominance can be attributed to the software's flexibility, scalability, and seamless integration capabilities. Unlike hardware-based solutions, which often necessitate significant investments in infrastructure, software components can be implemented on existing hardware, lowering costs and simplifying implementation. This accessibility has democratized the adoption of graph technology, making it viable for various organizations, ranging from startups to large enterprises.
Services segment will grow at substantial pace. This accelerated growth is primarily attributed to the growing understanding among organizations that the effective adoption of graph technology involves more than just acquiring software tools. Services like consulting, training, and support have become essential in enabling businesses to fully leverage the capabilities of graph databases. Many enterprises now recognize the need for specialized expertise to design and implement customized graph data models, query languages, and analytical frameworks tailored to their specific requirements.
By Database Type Analysis
- Relational (SQL) segment accounted for the largest share over the forecast period
Relational (SQL) segment held the largest share. SQL databases became dominant due to their efficient management of structured data presented in tabular formats, a prevalent data structure for many years. These databases provide a well-established and standardized query language that is widely recognized and supported, simplifying data operations for organizations. Additionally, relational databases are renowned for their reliability and transactional capabilities, making them well-suited for crucial applications such as financial systems and e-commerce platforms.
Non-relational (No SQL) segment will grow at substantial pace. These databases are gaining momentum due to its effectiveness in managing intricate and inter-connected data structures. In the current data landscape, where understanding and utilizing connections between data elements are crucial, these databases offer a more intuitive and efficient solution.
By Analysis Model Analysis
- Path Analysis segment accounted for the largest share
Path analysis segment held the largest share. Its dominance stems from its exceptional versatility across a wide array of applications. Path analysis offers invaluable insights by facilitating the exploration and comprehension of complex relationships within data. This fundamental concept serves as the backbone for numerous fields, ranging from social network analysis and recommendation engines to cybersecurity and logistics optimization.
Community analysis segment will grow at substantial pace. Segment’s growth is driven by its capacity to reveal concealed structures and insights within interconnected data. In the current data-rich landscape, comprehending the communities or clusters within a network is crucial for diverse applications such as social network analysis, fraud detection, and recommendation systems. Graph technology, enhanced with specialized algorithms and techniques, has streamlined community analysis, making it more accessible and efficient than ever before.
Regional Insights
- The demand in North America garnered the largest share in 2022
The North America region dominated the global market. The region's vibrant technology ecosystem, epitomized by Silicon Valley, has nurtured innovation and investment in emerging technologies, including graph databases. Region is home to a plethora of technology startups and well-established enterprises, both of which eagerly embrace state-of-the-art solutions to maintain their competitive edge. Furthermore, organizations in the region is frequently confront intricate data challenges, prompting them to swiftly acknowledge the benefits of graph technology, especially in sectors such as e-commerce, healthcare, and finance.
APAC will grow at rapid pace. This acceleration is attributed to various factors aligning with the region's swift digital transformation. As businesses throughout the region embrace data-driven approaches, the necessity to understand intricate relationships within their data has become more pronounced. Graph technology presents a tailored solution to meet this growing demand. Additionally, the region's diverse economies, ranging from established technology centers like India and Singapore to emerging markets in Southeast Asia, create a dynamic environment for technology adoption and innovation.
Key Market Players & Competitive Insights
The market's competitive arena is constantly changing and developing. Established companies like Neo4j maintain their leadership position with sophisticated, feature-packed, and scalable graph database solutions. Simultaneously, open-source options like Apache TinkerPop offer accessible alternatives. Emerging players and startups, such as TigerGraph and Stardog, are making strides by introducing innovative methods for managing and analyzing graph data.
Some of the major players operating in the global market include:
- Amazon Web Services, Inc.
- ArangoDB, Inc.
- DataStax
- IBM
- Microsoft
- Neo4j, Inc.
- Oracle Corporation
- Progress Software Corporation (MarkLogic)
- Stardog
- TigerGraph
Recent Developments
- In January 2023, Katana Graph, the company behind the AI-driven Graph Intelligence Platform, has announced an expanded partnership with Intel. This collaboration is designed to streamline the process for data scientists, enabling them to extract deep insights from vast interconnected datasets more efficiently.
- In April 2021, MANTA, announced a new collaboration with Neo4j, a leading player in the graph technology domain. This partnership involves the direct integration of Neo4j's graph database technology into the MANTA platform, enhancing its capabilities for in-depth pipeline analysis.
Graph Technology Market Report Scope
|
Report Attributes |
Details |
|
Market size value in 2023 |
USD 3.95 billion |
|
Revenue forecast in 2032 |
USD 23.48 billion |
|
CAGR |
21.9% from 2023 – 2032 |
|
Base year |
2022 |
|
Historical data |
2019 – 2021 |
|
Forecast period |
2023 – 2032 |
|
Quantitative units |
Revenue in USD billion and CAGR from 2023 to 2032 |
|
Segments covered |
By Component, By Database Type, By Graph Type, By Analysis Model, By Deployment, By Application, By End Use, By Region |
|
Regional scope |
North America, Europe, Asia Pacific, Latin America; Middle East & Africa |
|
Customization |
Report customization as per your requirements with respect to countries, region and segmentation. |
