
Steam Turbine Market Share, Size, Trends, Industry Analysis Report, 2022 - 2030
REPORT DETAILS
REPORT DETAILS
ABOUT THIS REPORT
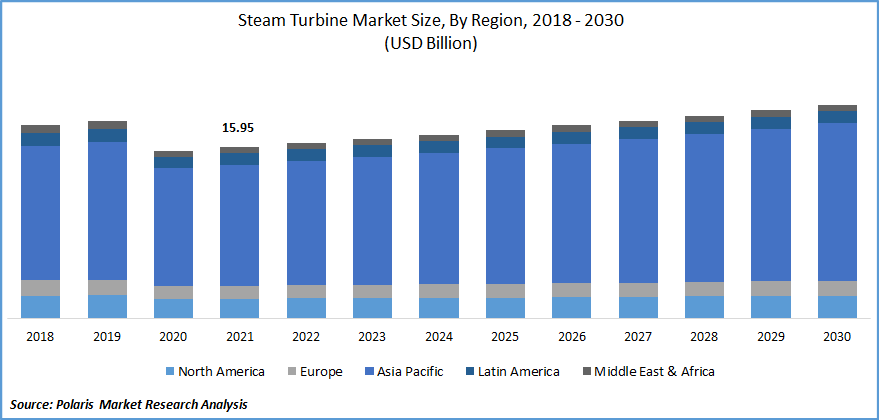
The steam turbine market was valued at USD 15.95 billion in 2021 and is expected to grow at a CAGR of 2.5% during the forecast period. Key factors driving the industry forward include innovation in steam engines, the rising need for clean fuel-operated locomotive engines, and an increase in globalization and trade activities across the globe. Steam engines are employed in sea route vehicles.
Know more about this report: Download Sample Report
An increasing focus on energy optimization and cogeneration will positively change the corporate landscape. Additionally, government measures to reduce coal-fired power generation and the competitive costs of renewable technologies could hinder industry growth. A combination of increasing investments in large-scale thermal power projects and regulation to reduce carbon emissions will result in a strong steam turbine market in the future.
It heats water to extremely high temperatures (gas, coal, nuclear, solar) until steam is produced. Steam flows from the blades of a turbine during the process of steam expanding and cooling. The rotating turbine's blades convert the steam's potential into kinetic energy.
Due to their rotary motion, they are suitable for driving electrical generators to generate electricity. The turbines are connected to a generator with an axle, producing energy via a magnetic field with an electric current. It is a mechanical device that converts the potential energy of steam into kinetic energy. It is followed by the mechanical energy of the turbine shaft.
The novel coronavirus has rapidly spread across different countries and regions and continues to spread, causing an immense effect on the lives of individuals and the overall community. Additionally, because of the COVID-19 pandemic, industry participants must deal with supply chain disruptions, coronavirus outbreaks, and the closing of a production facility. The COVID outbreak has had a negative impact on infrastructure development during the pandemic, which hinders industry growth.
Know more about this report: Download Sample Report
Industry Dynamics
Growth Drivers
It is common and cost-effective to include gas in processes that generate electricity to be used to operate the facility. They are utilized in the chemical and pharmaceutical sectors, where electricity and heat drive numerous processes. Similar methods for creating energy from waste include steam turbines- the heat produced during the combustion of waste material powers a specialized and effective steam turbine. They are also widely used in the oil and gas, pulp and paper, solar power, sugar, and ethanol industries.
In addition, urbanization and industrialization drive the market in the forecasted period. On the other hand, the competitive cost of renewable technologies and government initiatives to minimize dependence on coal-fired power generation could constrain the expansion of the steam turbine market. Regulations designed to reduce carbon emissions and increase funding for the construction of large-scale thermal power plants will also drive the industry.
Report Segmentation
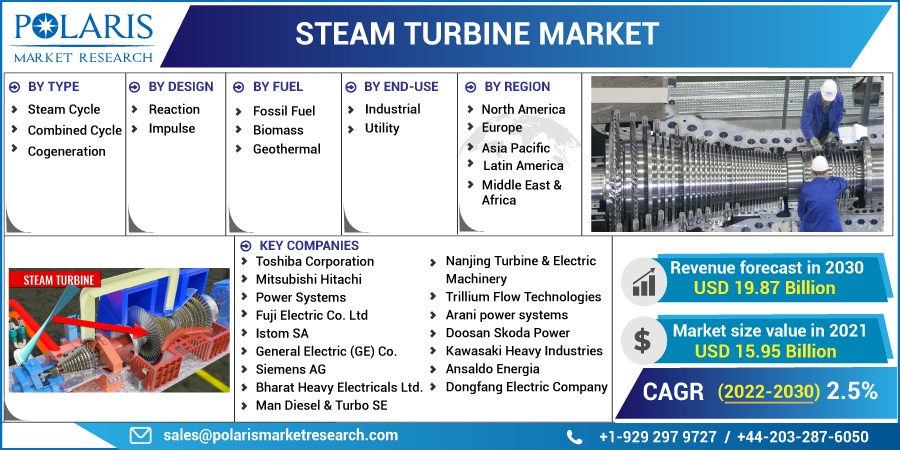
The market is primarily segmented based on type, design, fuel, end-use, and Region.
| By Type | By Design | By Fuel | By End-Use | By Region |
|
|
|
|
|
Know more about this report: Download Sample Report
Combined Cycle Segment is Expected to Witness the Fastest Growth
In 2021, the combined cycle segment accounted for the largest share in the steam turbine market. A combined-cycle power system is the traditional technology of choice for most large onshore power generation plants. A gas turbine is often used in a combined-cycle power system to power an electrical generator while recovering waste heat from the exhaust to produce steam.
Waste heat steam is passed via a steam turbine to produce more electricity. A combined-cycle power system's overall electrical efficiency is typically 50 to 60 percent, which is significantly higher than the 33 percent efficiency of a straightforward open-cycle application.
Impulse Accounted for the Second-Largest Market Share in 2021
The Impulse segment will hold the second largest market share in the global market. During the forecast period, the Impulse segment is expected to be used more frequently due to its compact size and economic properties.
A significant factor driving steam turbine demand is government investment in expanding infrastructure and an increase in demand from power generation industries. In addition, rapid industrialization and migration of individuals from rural to urban areas in developing nations led to a huge demand for power.
Biomass Segment is Expected to Witness Fastest Growth
The biomass segment is expected to register a robust growth rate over the study period. This is primarily due to increasing efforts in decreasing carbon footprints with supportive legislation. The industry is expected to grow rapidly with captive power systems and combined heat and power systems.
Whereas geothermal energy segment is expected to be the most revenue generation segment over the coming years. As a result of various regulatory measures, non-conventional energy resources are being adopted more rapidly.
Utility Segment is Expected to Witness the Fastest Growth
It is likely that during the forecast period, the utility segment will lead the market share in the global market. The utility segment dominated the global market in 2021 in terms of revenue and is expected to maintain its dominance during the forecast period. The segment will grow as combined cycle technology becomes more widely deployed and onsite power generation equipment becomes more popular.
The Demand in Asia Pacific is Expected to Witness Significant Growth
Globally, Asia Pacific is estimated to hold the highest CAGR in the steam turbine market during the forecast period. The growth of the industry is expected to be driven in this region due to the increasing demand for electricity and the dominance of thermal sources in the electricity generation market. The need for industry in China and India has been fueled by the rapid industrial growth rate in both nations. In addition, India's vast population and development as the world's manufacturing hub will impact electricity demand. This will spur government and private investors' investments in constructing power generation plants and, in turn, stimulate the market in the Asia Pacific region during the forecast period.
Competitive Insight
Some of the market players functioning in the global market include. Toshiba Corporation, Mitsubishi Hitachi s, Fuji Electric, Istom SA, General Electric, Siemens AG, Bharat Heavy Electricals, Man Diesel, Nanjing Turbine & Electric, Trillium Flow Technologies, Arani power, Doosan Skoda Power, Kawasaki Heavy Industries, Ansaldo Energia, Dongfang Electric.
Recent Developments
- In February 2025, Doosan Škoda Power signed a contract with PAPREC ENGINEERING to deliver a 19 MW DST-G10 steam turbine, generator, gearbox, and auxiliaries for the Pierrefonds plant on Réunion Island. The facility will process 148,000 tons of waste annually, generating 121,000 MWh, with delivery set for April 2025.
- In February 2025, Siemens Energy partnered with Rolls-Royce SMR to supply steam turbines for Generation 3+ modular nuclear plants. The agreement covers integrated systems from design to commissioning, with capacities of 20–1,900 MW, supporting scalable, low-carbon SMR deployment worldwide.
- In October 2024, Shin Nippon Machinery won an order for four steam turbine drivers for Qatar’s North Field South LNG expansion. Meeting API 612 standards, the turbines will drive boiler feed pumps, boosting LNG capacity from 110 to 126 MTPA by 2027, while ensuring high reliability in demanding oil and gas operations.
- In June 2022, GE and BHEL manufactured 700 MW nuclear steam turbines under licences and technology transfer agreements. This project includes 12 units of 700 MWe that NPCIL is developing with their nuclear reactor technology, namely Pressurised Heavy Water Reactors (PHWR). It is 8.4GW of CO2-free electricity for the nation, sufficient to power more than 14 million homes.
- In February 2019, Toshiba supplies steam turbines and generators to the United States. Toshiba Energy Systems & Solutions Corporation (Toshiba ESS) provided a 450 MW STG to Toshiba America Energy. Entergy Texas owns and manages the plant in the United States.
Steam Turbine Market Report Scope
| Report Attributes | Details |
| Market size value in 2021 | USD 15.95 billion |
| Revenue forecast in 2030 | USD 19.87 billion |
| CAGR | 2.5% from 2022 – 2030 |
| Base year | 2021 |
| Historical data | 2018 – 2020 |
| Forecast period | 2022 – 2030 |
| Quantitative units | Revenue in USD billion and CAGR from 2022 to 2030 |
| Segments Covered | By Type, By Design, By Fuel, By End-Use, By Region |
| Regional scope | North America, Europe, Asia Pacific, Latin America, Middle East & Africa |
| Key Companies | Toshiba Corporation, Mitsubishi Hitachi Power Systems, Fuji Electric Co. Ltd, Istom SA, General Electric (GE) Co., Siemens AG, Bharat Heavy Electricals Ltd., Man Diesel & Turbo SE, Nanjing Turbine & Electric Machinery, Trillium Flow Technologies, Arani power systems, Doosan Skoda Power, Kawasaki Heavy Industries, Ansaldo Energia, Dongfang Electric Company |
Research Methodology
A robust system of research, verification, and forecasting designed to ensure reliable and actionable market insights.
Polaris Market Research & Consulting, Inc. uses a clear and structured approach to deliver insights that clients can rely on. The process combines detailed primary and secondary research, including direct communication with industry experts. The detailed information helps build a complete picture of market trends and developments. Secondary data is gathered from credible sources such as industry reports, company filings, government source links, and trusted organization databases. It is then cross-checked through discussions with key stakeholders across the value chain. Market size and forecasts are developed using both bottom-up and top-down methods to ensure accuracy and consistency in the final results.
1. Project Setup
Step 1 & 2:
- We start every project by clearly understanding the client’s objective or goal, then defining the market scope, and aligning regions, segments, and timelines.
- Once the foundation is set, we collect data from all-around of sources, including company reports, government databases, and paid industry platforms.
- Our research is based on secondary data, which helps us build a strong understanding of the market across regions and industries. Then we validate this information through primary research by speaking directly with industry experts, companies, and stakeholders.
- By combining secondary and primary research, we ensure that our market insights are accurate, practical, and closely aligned with real market conditions.
2. Data Collection
We gather information from both public and verified sources:
3. Data Structuring
Step 3:
- All collected data is organized into a consistent format to ensure accurate analysis. Since inputs come from multiple sources, they are standardized and aligned before use.
- The data is segmented by product, application, and region, and mapped across a defined historical period (2020–2024). All values are converted into common units (USD Mn/Bn), and volume and pricing are aligned where required to estimate revenue.
- Any overlaps or inconsistencies are reviewed and adjusted to maintain accuracy (<5% variance threshold).
- The result is a structured dataset that allows for clear comparison across regions and supports reliable analysis and forecasting.
Structured Market Dataset, USD Mn/Bn
| Region | Segment | VolumeUnits | Avg PriceUSD | RevenueUSD Mn | Share % |
|---|---|---|---|---|---|
| North America | Product A | 250 | 2.5 | 500 | 15% |
| Product A | XX | XX | XX | XX | |
| Product A | XX | XX | XX | XX | |
| Consistent methodology applied across regions | |||||
4. Market Estimation
Step 4: TOP-DOWN APPROACH
- We start with the overall market size at a global or macro level.
- The market is then narrowed down based on scope and industry relevance.
- We apply penetration rates and split the data by region and segment.
- This helps us estimate the market size for specific segments.
- The numbers are validated through cross-checks to ensure accuracy.
Step 5: BOTTOM-UP APPROACH
- We begin by analyzing data from leading companies in the market.
- Revenue data is collected and mapped across different segments.
- The data is then aggregated to estimate the total market size.
- To fill in any gaps, adjustments are made based on industry standards.
- Validation checks make sure that the results are correct.
5. Forecasting
Step 6:
At Polaris Market Research & Consulting, Inc., we employ a methodical forecasting strategy. This approach blends the analysis of historical data with real-time market validation. To forecast future trends with precision, we examine past patterns, pricing fluctuations, and the interplay of supply and demand. To ensure our conclusions reflect the present market landscape, we actively seek input from industry experts and key stakeholders.
To refine our predictions, we carefully consider critical elements such as market drivers and restraints, fluctuations in raw material costs, emerging technologies, and the production capabilities of various regions. Furthermore, we assess regulatory frameworks and potential policy shifts to gauge their potential impact on market expansion.
All this information is synthesized to generate precise forecasts for each segment and region. These forecasts illuminate the current state of the market and highlight forthcoming opportunities.
6. Validation & Triangulation
Step 7:
In the final stage, we validate all our estimates using a triangulation method, where data is cross-checked from multiple reliable sources, like company data, primary interviews, and secondary research. This helps us make sure that our numbers are correct and fit with the rest of the market.
This process involves verifying data consistency across various segments and geographic areas. It also requires comparing historical trends with the assumptions support the forecast. Any discrepancies involve adjustments to ensure everything remains aligned and dependable.
Once the data is finalized, we prepare the final outputs, including market size estimates, segment-wise breakdowns, and growth metrics. These are delivered in structured formats such as tables, charts, and data files for easy analysis and use.
We collaborate closely with clients, ensuring the final products align with their requirements. This includes offering tailored adjustments, supplementary data analyses, and continuous assistance. Furthermore, we monitor market trends post-delivery, providing updates and refinements to maintain the insights' relevance as time passes.
Triangulation Framework
Estimates are cross-verified across three sources:
Company-level data
• Primary inputs from industry participants
• Secondary benchmarks and published data
Variance maintained within +5-10%
Adjustments applied to align estimates
Segment values validated against overall market structure
Data Consistency & Integrity
Segment totals validated to 100%
Regional estimates aligned with global market size
Historical trends compared against forecast outputs
Assumptions reviewed for cross-segment and regional alignment
Final Outputs
Deliverables
Client Alignment & Support
- Deliverables are aligned with defined client requirements and scope
- Custom data cuts and segment splits are incorporated as required
- Post-delivery queries are addressed through analyst interactions
- Additional clarifications and data support are provided upon request
Client Continuity & Updates
- Market developments are tracked post-delivery to capture changes in key trends
- Updated data and revisions are provided based on new market inputs
- Additional refinements and data cuts are shared as required
- Continued analyst engagement supports evolving client requirements
Download Sample Report of Steam Turbine Market
Please fill out the form to request a customized copy of the research report.
