
Food Fortifying Agents Market Share, Size, Trends, Industry Analysis Report, 2024 - 2032
REPORT DETAILS
REPORT DETAILS
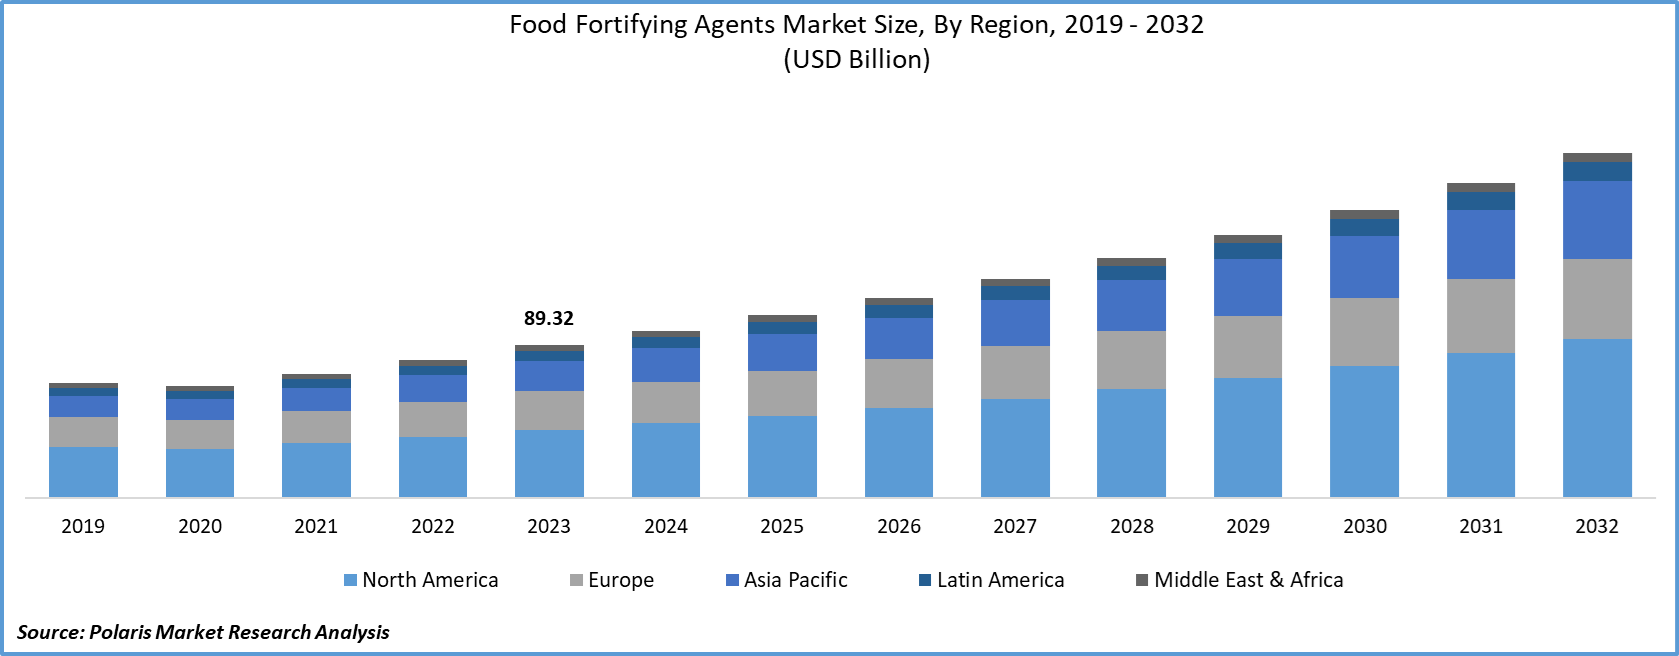
The global food fortifying agents market size was valued at USD 89.32 billion in 2023. The market is anticipated to grow from USD 97.73 billion in 2024 to USD 202.15 billion by 2032, exhibiting the CAGR of 9.5% during the forecast period.
Food fortification is the practice of boosting a food's nutritional value by including micronutrients in it. To eliminate nutritional deficiencies in the people, manufacturers and the government are working together as part of public healthcare policy. The substances used to improve nutritional value are known as food-fortifying substances. The fortification of food can be done in three different ways: commercially, bio-fortification, as well as at home.
Know more about this report: Download Sample Report
The increased demand for nutritious foods is the primary driver of food-fortifying agents. Since people's lifestyles are changing, there is an increase in consumer knowledge of healthy food options. The changing lifestyle of people, such as an increase in the demand for nutrient foods and vegan products, also the eating habits of bakery items after food, has led to an increase in the demand for food fortifying agents.
The rising chronic conditions among the people are the major factor boosting the demand for food-fortifying agents. It aids in the reduction of chronic conditions brought on by a lack of nutrient-rich meals, including high blood pressure, cardiovascular disease, Alzheimer's disease, and many others. For instance, As per the Alzheimer's Association, Alzheimer's affects more than 6 million Americans of all ages. In 2022, there will be 6.5 million Americans 65 and older who have Alzheimer's. 73% of people are 75 years of age or older. Alzheimer's affects 1 in 9 people aged 65 and older (10.7%).
Additionally, the market will benefit from the growing elderly population, which has considerably raised the demand for fortified foods due to various medical conditions such as adult malnutrition. For instance, in June 2021, Manna iStrong, a multigrain instantaneous drink mix for women with added iron, was introduced by Southern Health Foods Pvt. Ltd. in the market for women's health beverages. Hence, the initiative by the significant players of product launches with medicinal benefits is the factor boosting the market growth over the forecast period.
The COVID-19 outbreak has significantly impacted food fortifying agents due to heightened consumer awareness in food selection. The market for these products and their components is driven by this tendency toward an ecological, regenerative, plant-based diet and the desire for foods and beverages that contain elements that improve immunity. Most food and beverage companies also intend to seize both home and foreign markets, concentrating on broadening applications and introducing new product offerings.
Industry Dynamics
Growth Drivers
The global food and beverage industry's growing demand for food fortifying agents to boost food's nutritional value and micronutrient content would help the market expand. For instance, in March 2022, The Nigerian government teamed up with local and international groups to establish a pilot program to create a digital system to ensure that basic foods are fortified with the appropriate levels of important vitamins and minerals supporting optimum nutrition and health. The system also aims to monitor fortified meals to ensure they effectively access Nigerian consumers.
Further, the bakery and confectionary, dairy goods, dietary supplements, beverages, and other industries are those that use food-fortifying agents. Dietary supplements are one of these businesses, and the usage of food-fortifying agents is rising due to consumer knowledge of the health advantages and a shift in consumer consumption toward nutraceuticals like vitamins and minerals. Due to expanding demand for sports nutrition beverages and increased consumption of functional beverages, there is also a demand for food-fortifying agents in the beverage industry. Food fortifying agents are encouraged by other businesses, including those producing bakery and confectionery goods, dairy goods, morning cereals, and infant formula. Thus, the wide adoption across the applications is propelling the growth.
Report Segmentation
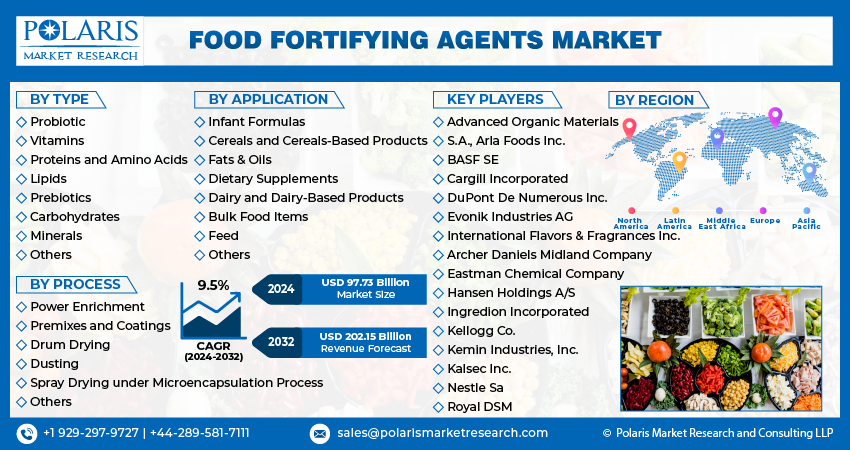
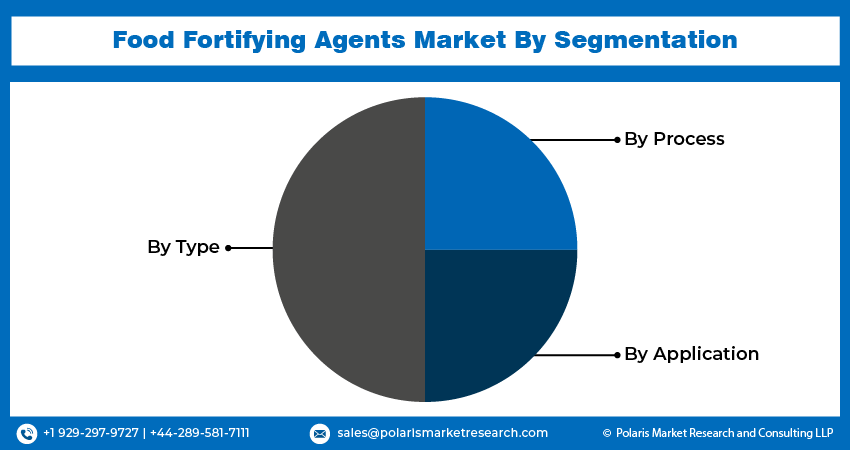
The market is primarily segmented based on type, process, application, and region.
| By Type | By Process | By Application | By Region |
|
|
|
|
Know more about this report: Download Sample Report
Minerals Segment is Expected to Witness the Fastest Growth
Minerals are inorganic compounds that plants can acquire from soil and water. Minerals from the plants that mammals eat are absorbed by them. Microminerals and macrominerals are two further categories. While both are essential, micro minerals are needed in smaller quantities than macro minerals. Due to its use in items like infant foods, meat products, breakfast cereals, and health drinks, among many others, the category is experiencing the fastest expansion in the market.
The Vitamins Segment Industry Accounted for the Highest Market Share in 2021
The vitamin segment holds the highest share due to rising consumer health consciousness and vitamin deficiency, which can result in health diseases. Additionally, investigations have shown that these disorders are not just deficiency diseases but also ones that exist in a community that is generally well-nourished. Thus, it was established that vitamin fortification of food successfully addressed the populace's nutritional deficits. Further, due to the increase of vitamin deficiency-related diseases like osteoporosis and rickets, the rising cost of healthcare, and the expanding aging of people, the vitamin sector accounts for a sizeable portion of the global economy. The growing older population and interest in personal fitness are mostly aimed at them.
Bulk Food is Expected to Hold a Significant Revenue Share
The popularity of this application might be ascribed to the rising demand for premium food goods and shifting health preferences, which in turn raises the need for food-fortifying agents. The market is fueled by customers' rising health consciousness, which pushes businesses to provide different food-fortifying agents for functional foods, drinks, dietary supplements, infant formula, and dairy products due to their health benefits. It is meant for intervention programs to treat the deficit in a particular target demographic. Fortification of bulk food products is an appropriate carrier for the micronutrient and is consumed worldwide by the general population.
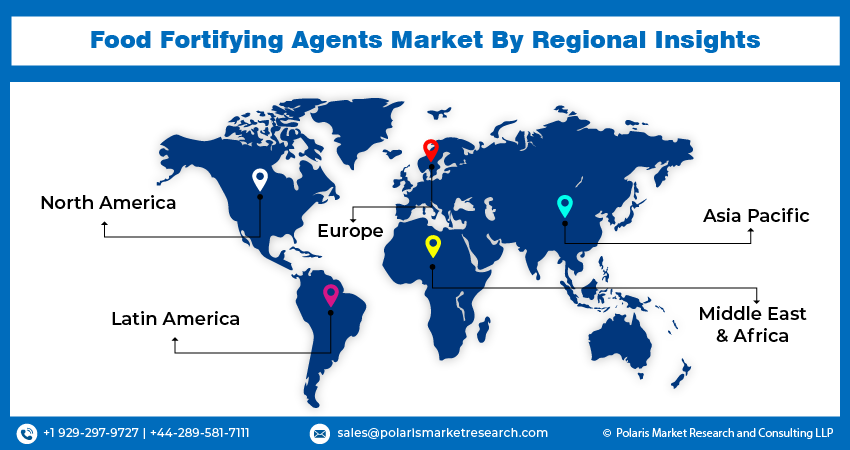
The Demand in North America is Expected to Witness Significant Growth
North America holds the largest share due to the increase in obesity and chronic diseases; consumers are choosing healthier foods, which is boosting the market for food-fortifying agents. For instance, as per the CDC, One or more chronic diseases, such as diabetes, cancer, heart disease, and stroke, affect six out of ten Americans. These and other chronic illnesses are the main contributors to health care costs and the major causes of death and disability in the United States. Also, in America, about 40% of persons who are 20 or older are obese. Obesity affects 71.6% of persons aged 20 and older who are overweight. Thus, this rising prevalence of the disease has increased the demand for food with nutritional benefits. Also, due to consumer knowledge of food and nutrition, North America holds the most significant market share for food fortifying agents.
A large portion of the market is held by Asia Pacific, which can be due to the region's abundance of manufacturers and the region's rapidly growing population in countries. The prevalence of chronic illnesses is rising quickly in China and India, which raises the need for food-fortifying agents in these countries. As a result, the industry is adopting food-fortifying chemicals more frequently. In developing nations like India and Nigeria, food-fortifying chemicals are utilized to bridge the gap between agriculture and nutrition.
Competitive Insight
Global players include
- Archer Daniels Midland Company
- Advanced Organic Materials
- Arla Foods
- BASF SE
- Cargill Incorporated
- DuPont
- Evonik Industries
- International Flavors & Fragrances
- Eastman Chemical Company
- Hansen Holdings
- Ingredion Incorporated
- Kellogg
- Kemin Industries
- Kalsec
- Nestle
- Royal DSM.
Recent Developments
- In May 2025, Xampla developed a plant-based microencapsulation technology for Vitamin D fortification in foods and beverages. Using pea protein, the technology creates microscopic capsules that protect Vitamin D during processing, storage, and digestion, ensuring stability and bioavailability.
- In January 2022, Nirogam Ayurveda is getting ready to introduce its new food segment. The newly launched division is known as Mysca. Food products like cookies, crispies, jam, etc. that have been ayurvedically fortified will be introduced under this section.
- In November 2021, The Norwegian business Vestkorn Milling was purchased by Royal DS for an asset value of EUR 65 million. It is is well positioned, delivering proteins, carbohydrates, & dietary fibers for vegan, in addition to pet food and livestock feed.
Food Fortifying Agents Market Report Scope
| Report Attributes | Details |
| Market size value in 2024 | USD 97.73 billion |
| Revenue forecast in 2032 | USD 202.15 billion |
| CAGR | 9.5% from 2024 - 2032 |
| Base year | 2023 |
| Historical data | 2018 - 2020 |
| Forecast period | 2024 - 2032 |
| Quantitative units | Revenue in USD billion and CAGR from 2024 - 2032 |
| Segments Covered | By Type, By Process, By Application, By Region |
| Regional scope | North America, Europe, Asia Pacific, Latin America, Middle East & Africa |
| Key Companies | Archer Daniels Midland Company, Advanced Organic Materials, S.A., Arla Foods Inc. BASF SE, Cargill Incorporated, DuPont De Numerous Inc., Evonik Industries AG, International Flavors & Fragrances Inc., Eastman Chemical Company, Hansen Holdings A/S, Ingredion Incorporated, Kellogg Co., Kemin Industries, Inc., Kalsec Inc., Nestle Sa, and Royal DSM. |
FAQ's
Food fortifying agents are essential nutrients like vitamins, minerals, probiotics, and amino acids added to foods to enhance nutritional value and combat global malnutrition.
The global food fortifying agents market was valued at approximately USD 89.32 billion in 2023 and is projected to reach USD 202.15 billion by 2032.
North America leads the food fortifying agents market with a 30-38% share, driven by high consumer awareness, regulatory support, and advanced food manufacturing infrastructure.
Probiotics and prebiotics are the fastest-growing segments, expected to grow at 9.5% CAGR, driven by increasing gut health awareness and functional food demand.
Dairy products lead with the largest market share, followed by beverages, which are the fastest-growing application due to rising demand for functional and health-focused drinks.
Research Methodology
A robust system of research, verification, and forecasting designed to ensure reliable and actionable market insights.
Polaris Market Research & Consulting, Inc. uses a clear and structured approach to deliver insights that clients can rely on. The process combines detailed primary and secondary research, including direct communication with industry experts. The detailed information helps build a complete picture of market trends and developments. Secondary data is gathered from credible sources such as industry reports, company filings, government source links, and trusted organization databases. It is then cross-checked through discussions with key stakeholders across the value chain. Market size and forecasts are developed using both bottom-up and top-down methods to ensure accuracy and consistency in the final results.
1. Project Setup
Step 1 & 2:
- We start every project by clearly understanding the client’s objective or goal, then defining the market scope, and aligning regions, segments, and timelines.
- Once the foundation is set, we collect data from all-around of sources, including company reports, government databases, and paid industry platforms.
- Our research is based on secondary data, which helps us build a strong understanding of the market across regions and industries. Then we validate this information through primary research by speaking directly with industry experts, companies, and stakeholders.
- By combining secondary and primary research, we ensure that our market insights are accurate, practical, and closely aligned with real market conditions.
2. Data Collection
We gather information from both public and verified sources:
3. Data Structuring
Step 3:
- All collected data is organized into a consistent format to ensure accurate analysis. Since inputs come from multiple sources, they are standardized and aligned before use.
- The data is segmented by product, application, and region, and mapped across a defined historical period (2020–2024). All values are converted into common units (USD Mn/Bn), and volume and pricing are aligned where required to estimate revenue.
- Any overlaps or inconsistencies are reviewed and adjusted to maintain accuracy (<5% variance threshold).
- The result is a structured dataset that allows for clear comparison across regions and supports reliable analysis and forecasting.
Structured Market Dataset, USD Mn/Bn
| Region | Segment | VolumeUnits | Avg PriceUSD | RevenueUSD Mn | Share % |
|---|---|---|---|---|---|
| North America | Product A | 250 | 2.5 | 500 | 15% |
| Product A | XX | XX | XX | XX | |
| Product A | XX | XX | XX | XX | |
| Consistent methodology applied across regions | |||||
4. Market Estimation
Step 4: TOP-DOWN APPROACH
- We start with the overall market size at a global or macro level.
- The market is then narrowed down based on scope and industry relevance.
- We apply penetration rates and split the data by region and segment.
- This helps us estimate the market size for specific segments.
- The numbers are validated through cross-checks to ensure accuracy.
Step 5: BOTTOM-UP APPROACH
- We begin by analyzing data from leading companies in the market.
- Revenue data is collected and mapped across different segments.
- The data is then aggregated to estimate the total market size.
- To fill in any gaps, adjustments are made based on industry standards.
- Validation checks make sure that the results are correct.
5. Forecasting
Step 6:
At Polaris Market Research & Consulting, Inc., we employ a methodical forecasting strategy. This approach blends the analysis of historical data with real-time market validation. To forecast future trends with precision, we examine past patterns, pricing fluctuations, and the interplay of supply and demand. To ensure our conclusions reflect the present market landscape, we actively seek input from industry experts and key stakeholders.
To refine our predictions, we carefully consider critical elements such as market drivers and restraints, fluctuations in raw material costs, emerging technologies, and the production capabilities of various regions. Furthermore, we assess regulatory frameworks and potential policy shifts to gauge their potential impact on market expansion.
All this information is synthesized to generate precise forecasts for each segment and region. These forecasts illuminate the current state of the market and highlight forthcoming opportunities.
6. Validation & Triangulation
Step 7:
In the final stage, we validate all our estimates using a triangulation method, where data is cross-checked from multiple reliable sources, like company data, primary interviews, and secondary research. This helps us make sure that our numbers are correct and fit with the rest of the market.
This process involves verifying data consistency across various segments and geographic areas. It also requires comparing historical trends with the assumptions support the forecast. Any discrepancies involve adjustments to ensure everything remains aligned and dependable.
Once the data is finalized, we prepare the final outputs, including market size estimates, segment-wise breakdowns, and growth metrics. These are delivered in structured formats such as tables, charts, and data files for easy analysis and use.
We collaborate closely with clients, ensuring the final products align with their requirements. This includes offering tailored adjustments, supplementary data analyses, and continuous assistance. Furthermore, we monitor market trends post-delivery, providing updates and refinements to maintain the insights' relevance as time passes.
Triangulation Framework
Estimates are cross-verified across three sources:
Company-level data
• Primary inputs from industry participants
• Secondary benchmarks and published data
Variance maintained within +5-10%
Adjustments applied to align estimates
Segment values validated against overall market structure
Data Consistency & Integrity
Segment totals validated to 100%
Regional estimates aligned with global market size
Historical trends compared against forecast outputs
Assumptions reviewed for cross-segment and regional alignment
Final Outputs
Deliverables
Client Alignment & Support
- Deliverables are aligned with defined client requirements and scope
- Custom data cuts and segment splits are incorporated as required
- Post-delivery queries are addressed through analyst interactions
- Additional clarifications and data support are provided upon request
Client Continuity & Updates
- Market developments are tracked post-delivery to capture changes in key trends
- Updated data and revisions are provided based on new market inputs
- Additional refinements and data cuts are shared as required
- Continued analyst engagement supports evolving client requirements
Download Sample Report of Food Fortifying Agents Market
Please fill out the form to request a customized copy of the research report.
