
Electronic Toll Collection Market Size & Share Global Analysis Report, 2023-2032
REPORT DETAILS
REPORT DETAILS
ABOUT THIS REPORT
The global electronic toll collection market was valued at USD 9,492.07 million in 2022 and is expected to grow at a CAGR of 6.9% during the forecast period.The market is experiencing significant growth due to the increasing adoption of digital technologies over manual toll-collection systems. This transition is driven by various factors, including the need to address traffic congestion issues and enhance the speed and efficiency of traffic flow. ETC systems enable vehicles to pass through tolls without stopping, utilizing electronic means to charge tolls to established customer accounts.
To Understand More About this Research: Download Sample Report
One of the market's primary drivers is the escalating traffic congestion problem in many regions. As traffic increases, the manual toll collection system becomes inefficient and time-consuming, leading to delays and frustration for drivers. ETC systems offer a more streamlined and convenient approach, reducing traffic congestion and saving drivers' time. This convenience factor has contributed to the growing demand for ETC systems.
However, the emergence of the COVID-19 pandemic severely impacted the electronic toll collection market. Lockdowns and strict regulations implemented worldwide limited people's movement, reducing transportation demand. The disruption in the supply chain also led to a decline in economic activities, further affecting transportation and logistics services. Many manufacturers had to temporarily close their production sites to contain the spread of the virus.
Despite the challenges posed by the pandemic, the electronic toll collection market is expected to recover and continue its growth trajectory. In response to the evolving market landscape, ETC system providers focus on strategic measures such as acquisitions, partnerships, and collaborations to bring innovative system solutions.
Industry Dynamics
Growth Drivers
The key advantage of electronic toll collection systems is the increased convenience offered by cashless payments. With traditional manual toll collection systems, drivers must carry and exchange cash or use physical payment methods like tickets or tokens, which can be time-consuming and inconvenient.
In contrast, ETC systems enable cashless transactions, allowing drivers to pay their tolls electronically through pre-established accounts or other digital payment methods such as credit cards, debit cards, or mobile wallets. This eliminates the need for physical currency and facilitates a seamless payment process.
The convenience of cashless payments in ETC systems offers several benefits. Firstly, it saves drivers time by eliminating the need to stop at toll booths or search for exact change. This contributes to smoother traffic flow and reduces congestion, enhancing overall roadway efficiency.
Additionally, cashless payments provide a more secure and efficient means of payment. It reduces the risk of theft or loss associated with carrying cash and provides a digital trail for transaction records and reconciliation. Moreover, it allows for easier management of toll accounts, as drivers can conveniently track their toll expenses and make payments online or through mobile applications.
Report Segmentation
The market is primarily segmented based on type, offering, technology, application, and region.
| By Type | By Offering | By Technology | By Application | By Region |
|
|
|
|
|
To Understand the Scope of this Report: Request Customization
Transponder-/tag-based tolling system is expected to experience a higher revenue share during the forecast period.
The transponder-/tag-based tolling system is expected to experience a higher revenue share during the forecast period in the market. This system relies on transponders or tags installed in vehicles, enabling automatic and contactless toll payments. The transponder-/tag-based tolling system offers numerous advantages, including improved accuracy, faster processing times, reduced congestion, and enhanced driver convenience. With its seamless and user-friendly operation, this system is anticipated to witness increased adoption, driving its higher growth rate in the ETC market.
Additionally, technological advancements, such as the integration of RFID and GPS technologies, further enhance the capabilities of the transponder-/tag-based tolling system, making it a preferred choice for toll operators and governments looking to improve efficiency and enhance the overall tolling experience.
The RFID segment is anticipated to exhibit a substantial growth rate during the forecast period.
The RFID (Radio Frequency Identification) segment is anticipated to exhibit a substantial growth rate during the forecast period. RFID technology enables automatic identification and tracking of vehicles using radio frequency signals, making it an integral part of modern tolling systems. RFID-based ETC systems offer several advantages, including high accuracy, reliable performance, and quick processing times.
The increasing demand for contactless and efficient toll-collection solutions drives the RFID segment's growth. Governments and toll operators worldwide recognize RFID technology’s benefits in streamlining toll operations, reducing traffic congestion, and enhancing the overall user experience. Additionally, ongoing technological advancements and cost-effective RFID solutions contribute to the segment's significant growth rate, making it a preferred choice for ETC implementations in various regions.
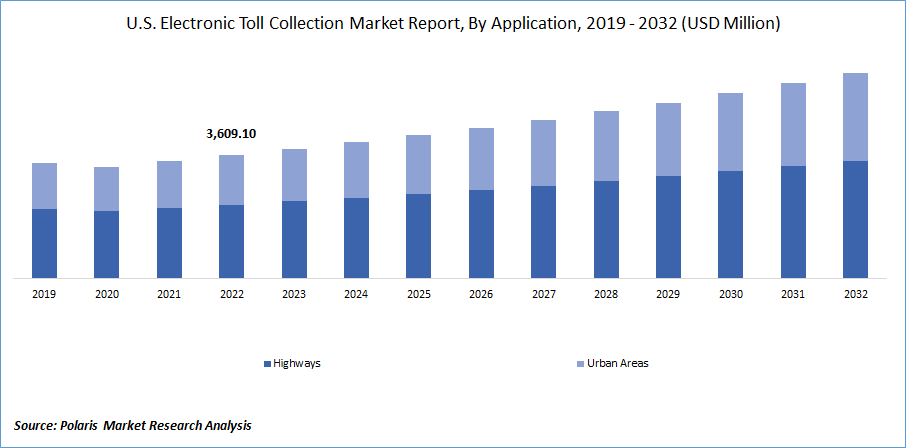
The highways segment is projected to experience a higher revenue share during the forecast period.
The highways segment is projected to experience a higher revenue share during the forecast period. This growth can be attributed to various factors. Firstly, governments and transportation authorities are increasingly focusing on improving the efficiency and management of toll collection on highways to reduce congestion and enhance traffic flow. Secondly, the expansion and development of new highways and expressways in emerging economies are driving the demand for effective toll-collection systems.
Additionally, the highway segment often witnesses higher traffic volumes, making the implementation of efficient ETC systems crucial for faster and smoother toll transactions. The adoption of advanced technologies and the integration of intelligent transportation systems further contribute to the growth of the highway segment in the ETC market, ensuring accurate tolling and seamless user experience for highway users.
North America dominated the global market in 2022
North America emerged as the leading region, capturing the largest revenue share. This can be attributed to the region's strong focus on digital transformation and technological advancements, which have accelerated the adoption of electronic toll-collection systems. Additionally, the high rate of car ownership in North America compared to other regions presents a lucrative opportunity to expand the market.
Furthermore, the Asia Pacific region is projected to experience significant growth during the forecast period. This growth is driven by the rapidly increasing demand for vehicles and automobile production in the region's developing and developed countries. Moreover, there is a notable shift in customer preferences towards smart vehicles and advanced transportation solutions in the Asia Pacific, further contributing to the positive outlook of the electronic toll collection market in the region.
Competitive Insight
- Conduent Inc.
- Cubic Corporation
- Efkon GmbH
- Feig Electronic
- Jenoptik AG
- Kapsch Trafficcom AG
- Mitsubishi Heavy Industries Ltd.
- Neology Inc.
- Q-Free
- Raytheon Technologies Corporation
- Siemens
- Star Systems International Ltd.
- Thales
- Toshiba Corporation
- TransCore.
Recent Developments
- In July 2025, Kapsch TrafficCom launched a new generation of V2X tolling technology to enable a smoother tolling experience. The company also initiated a nationwide HGV toll system in Denmark based on GNSS and RFID, supporting dynamic tolling applications.
- In March 2025, Mitsubishi Heavy Industries introduced a Merging Support Information System based on sensing and communication technologies from its toll collection and ETC systems. The solution supports autonomous driving infrastructure by providing real-time information to vehicles entering highways, improving traffic flow and safety.
- In November 2021, SiVA, a Grupo Marhnos company, partnered with Thales to revolutionize toll collection in Guatemala by bringing Thales’s well-known PITZ® (Peage Intelligent Transport Zero) electronic toll collection system to the country’s vital Palin-Escuintla toll road corridor.
- In October 2019, TransCore introduced a new product that enables RVers to travel across the country using only one transponder to pay tolls electronically without stopping at a toll booth. RV Toll Pass was made to change how RVers travel through different tolling jurisdictions nationwide.
Electronic Toll Collection Market Report Scope
| Report Attributes | Details |
| Market size value in 2023 | USD 10,132.00 million |
| Revenue forecast in 2032 | USD 18,540.88 million |
| CAGR | 6.9% from 2023 – 2032 |
| Base year | 2022 |
| Historical data | 2019 – 2021 |
| Forecast period | 2023 – 2032 |
| Quantitative units | Revenue in USD million and CAGR from 2023 to 2032 |
| Segments Covered | By Type, By Offering, By Technology, By Application, By Region |
| Regional scope | North America, Europe, Asia Pacific, Latin America; Middle East & Africa |
| Key Companies | Conduent, Inc., Cubic Corporation, Efkon GmbH, Feig Electronic, Jenoptik AG, Kapsch Trafficcom AG, Mitsubishi Heavy Industries, Ltd., Neology, Inc., Q-Free, Raytheon Technologies Corporation, Siemens, Star Systems International Ltd., Thales, Toshiba Corporation, and TransCore. |
FAQ's
The global electronic toll collection market size is expected to reach USD 10,132.00 million by 2032.
Top market players in the Electronic Toll Collection Market are Conduent, Inc., Cubic Corporation, Efkon GmbH, Feig Electronic, Jenoptik AG, Kapsch Trafficcom AG.
North America contribute notably towards the global Electronic Toll Collection Market.
The global electronic toll collection market expected to grow at a CAGR of 6.9% during the forecast period.
The Electronic Toll Collection Market report covering key are type, offering, technology, application, and region.
Research Methodology
A robust system of research, verification, and forecasting designed to ensure reliable and actionable market insights.
Polaris Market Research & Consulting, Inc. uses a clear and structured approach to deliver insights that clients can rely on. The process combines detailed primary and secondary research, including direct communication with industry experts. The detailed information helps build a complete picture of market trends and developments. Secondary data is gathered from credible sources such as industry reports, company filings, government source links, and trusted organization databases. It is then cross-checked through discussions with key stakeholders across the value chain. Market size and forecasts are developed using both bottom-up and top-down methods to ensure accuracy and consistency in the final results.
1. Project Setup
Step 1 & 2:
- We start every project by clearly understanding the client’s objective or goal, then defining the market scope, and aligning regions, segments, and timelines.
- Once the foundation is set, we collect data from all-around of sources, including company reports, government databases, and paid industry platforms.
- Our research is based on secondary data, which helps us build a strong understanding of the market across regions and industries. Then we validate this information through primary research by speaking directly with industry experts, companies, and stakeholders.
- By combining secondary and primary research, we ensure that our market insights are accurate, practical, and closely aligned with real market conditions.
2. Data Collection
We gather information from both public and verified sources:
3. Data Structuring
Step 3:
- All collected data is organized into a consistent format to ensure accurate analysis. Since inputs come from multiple sources, they are standardized and aligned before use.
- The data is segmented by product, application, and region, and mapped across a defined historical period (2020–2024). All values are converted into common units (USD Mn/Bn), and volume and pricing are aligned where required to estimate revenue.
- Any overlaps or inconsistencies are reviewed and adjusted to maintain accuracy (<5% variance threshold).
- The result is a structured dataset that allows for clear comparison across regions and supports reliable analysis and forecasting.
Structured Market Dataset, USD Mn/Bn
| Region | Segment | VolumeUnits | Avg PriceUSD | RevenueUSD Mn | Share % |
|---|---|---|---|---|---|
| North America | Product A | 250 | 2.5 | 500 | 15% |
| Product A | XX | XX | XX | XX | |
| Product A | XX | XX | XX | XX | |
| Consistent methodology applied across regions | |||||
4. Market Estimation
Step 4: TOP-DOWN APPROACH
- We start with the overall market size at a global or macro level.
- The market is then narrowed down based on scope and industry relevance.
- We apply penetration rates and split the data by region and segment.
- This helps us estimate the market size for specific segments.
- The numbers are validated through cross-checks to ensure accuracy.
Step 5: BOTTOM-UP APPROACH
- We begin by analyzing data from leading companies in the market.
- Revenue data is collected and mapped across different segments.
- The data is then aggregated to estimate the total market size.
- To fill in any gaps, adjustments are made based on industry standards.
- Validation checks make sure that the results are correct.
5. Forecasting
Step 6:
At Polaris Market Research & Consulting, Inc., we employ a methodical forecasting strategy. This approach blends the analysis of historical data with real-time market validation. To forecast future trends with precision, we examine past patterns, pricing fluctuations, and the interplay of supply and demand. To ensure our conclusions reflect the present market landscape, we actively seek input from industry experts and key stakeholders.
To refine our predictions, we carefully consider critical elements such as market drivers and restraints, fluctuations in raw material costs, emerging technologies, and the production capabilities of various regions. Furthermore, we assess regulatory frameworks and potential policy shifts to gauge their potential impact on market expansion.
All this information is synthesized to generate precise forecasts for each segment and region. These forecasts illuminate the current state of the market and highlight forthcoming opportunities.
6. Validation & Triangulation
Step 7:
In the final stage, we validate all our estimates using a triangulation method, where data is cross-checked from multiple reliable sources, like company data, primary interviews, and secondary research. This helps us make sure that our numbers are correct and fit with the rest of the market.
This process involves verifying data consistency across various segments and geographic areas. It also requires comparing historical trends with the assumptions support the forecast. Any discrepancies involve adjustments to ensure everything remains aligned and dependable.
Once the data is finalized, we prepare the final outputs, including market size estimates, segment-wise breakdowns, and growth metrics. These are delivered in structured formats such as tables, charts, and data files for easy analysis and use.
We collaborate closely with clients, ensuring the final products align with their requirements. This includes offering tailored adjustments, supplementary data analyses, and continuous assistance. Furthermore, we monitor market trends post-delivery, providing updates and refinements to maintain the insights' relevance as time passes.
Triangulation Framework
Estimates are cross-verified across three sources:
Company-level data
• Primary inputs from industry participants
• Secondary benchmarks and published data
Variance maintained within +5-10%
Adjustments applied to align estimates
Segment values validated against overall market structure
Data Consistency & Integrity
Segment totals validated to 100%
Regional estimates aligned with global market size
Historical trends compared against forecast outputs
Assumptions reviewed for cross-segment and regional alignment
Final Outputs
Deliverables
Client Alignment & Support
- Deliverables are aligned with defined client requirements and scope
- Custom data cuts and segment splits are incorporated as required
- Post-delivery queries are addressed through analyst interactions
- Additional clarifications and data support are provided upon request
Client Continuity & Updates
- Market developments are tracked post-delivery to capture changes in key trends
- Updated data and revisions are provided based on new market inputs
- Additional refinements and data cuts are shared as required
- Continued analyst engagement supports evolving client requirements
Download Sample Report of Electronic Toll Collection Market
Please fill out the form to request a customized copy of the research report.
