
Special Mission Aircraft Market Share, Size, Trends, Industry Analysis Report, 2022 - 2030
REPORT DETAILS
REPORT DETAILS
ABOUT THIS REPORT
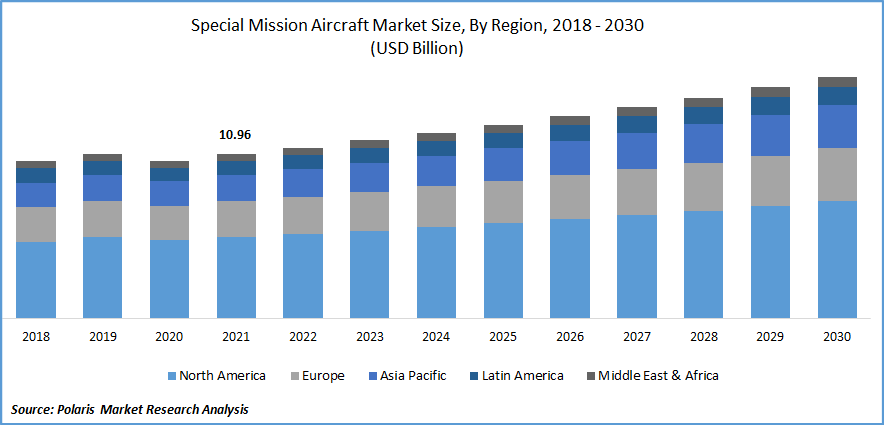
The global special mission aircraft market was valued at USD 10.96 billion in 2021 and is expected to grow at a CAGR of 4.4% during the forecast period.
The global rise in geopolitical issues, increased military expenditure by many countries, and high development in sensor technology coupled with the growing need for low-cost aircraft, especially in emerging economies like India and China are key factors expected to drive the growth of the global market during the forecast period. High usage of UAVs in combat activities along with the rising prevalence of air-to-air refueling systems to enable foreign deployment is also likely to boost the growth and demand of the global market over the coming years. In September 2021, the Ministry of Defense, India, announced a deal with Airbus Defense and Space SA, of the value of USD 2.8 Bn for replacing India’s outdated 56 Avro aircraft from the 56 C-295MW carrier aircraft.
Know more about this report: Download Sample Report
The outbreak of the COVID-19 pandemic has significantly impacted the growth of the special mission aircraft market. As governments from several global nations send money to fight COVID-19, it is anticipated that less money had flowed into the defense industry. However, during the forecast period, demand for and production of special mission aircraft are likely to return to normal as conditions improve.
Industry Dynamics
Growth Drivers
The extensive rise in military spending by emerging economies is being driven due to growing geopolitical tensions and cross-border problems across the world. Special purpose aircraft assist in several types of duties such as maritime patrol, electronic warfare, search & rescue, & medevac, by serving as the low-cost multi-role alternatives. This is projected to boost the demand over the study period.
Another major factor driving the expansion of maritime patrol aircraft across various ocean borders is the desire for maritime security. To undertake ISR missions and protect the security of maritime boundaries, numerous naval forces are purchasing maritime surveillance aircraft in large quantities. For instance, in March 2022, an order for “King Air 350 Special Mission Maritime Patrol Aircraft” was placed with Bird AeroSystems. This aircraft comes with its advanced ASIO solution & offers the capability of maritime & coastal surveillance, & better monitoring capabilities.
Know more about this report: Download Sample Report
Report Segmentation
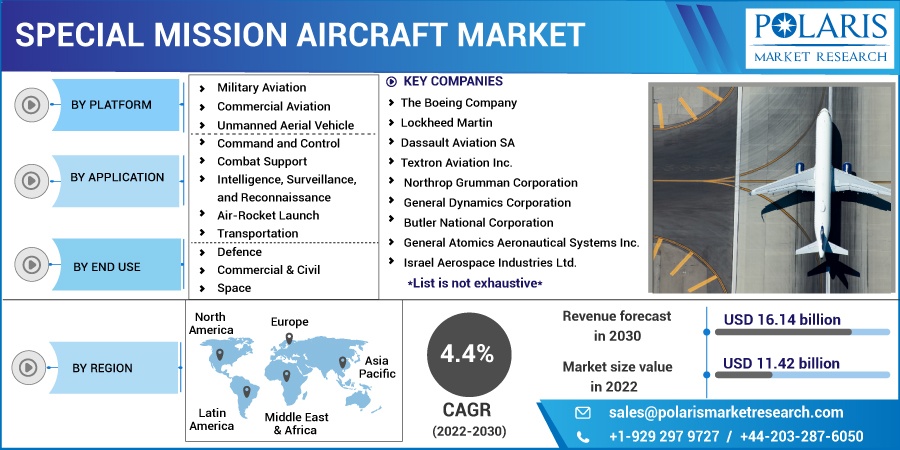
The market is primarily segmented based on platform, application, end-user, and region.
| By Platform | By Application | By End Use | By Region |
|
|
|
|
Know more about this report: Download Sample Report
Military aviation segment is expected to witness the fastest growth
During the forecast period, the military aviation segment is anticipated to have rapid growth owing to the high usage of these systems in various non-combat defense purposes including opponent tracking, supply deliveries, rescue missions, intelligence data collection, and rescue missions across the globe. In addition, an extensive rise in geopolitical issues is expected to create high-growth opportunities for the adoption of military aviation by several developing countries like India, China, and Indonesia.
Furthermore, the rising number of modernization programs coupled with the increasing procurement by several militaries across the world for enhancing their security and safety with the help of advanced and highly innovated defense systems are some other factors projected to fuel the demand and growth of the segment in the coming years. For instance, in March 2022, Germany announced that they will replace some of their aging Tornado bomber jets with highly innovative Lockheed Martin F-35A Lighting II aircraft having capabilities of carrying nuclear weapons into it.
Intelligence, surveillance, and reconnaissance segment accounted for the largest market share in 2021
The growth of the segment is majorly driven by an increasing number of surveillance aircraft acquisitions across the world due to the high tensions associated with land and sea borders in many countries and many other factors also such as high-seas piracy and drug trafficking. The high capability of these special mission aircraft to handle and operate surreptitiously and quietly has paved the way for higher adoption of these aircraft in surveillance, classification, detection, and identification of a maritime target, which is likely to impact the segment market positively over the coming years. Moreover, the increasing number of government initiatives by various government authorities to enhance the ISR and the increasing importance of aircraft in providing real-time data in many sensitive and crucial situations are propelling the segment growth at a significant growth rate.
Defense segment held the highest revenue share in 2021
The defense segment dominated the market in 2021 and is projected to maintain its dominance throughout the forecast period. Special mission aircraft are used in almost every defense branch with a variety of applications including maritime patrol, rocket launches, supply deliveries, and surveillance operations for performing several types of defense needs smoothly to ensure the safety and security of a nation are major key factors driving the growth of the market extensively over the coming years.
Additionally, various types of national law enforcement and intelligence agencies around the world are further expected to fuel the demand for special mission aircraft during the forecast period. However, the space segment is witnessing strong growth over the forecast period owing to a high number of space activities performed by many large private and government companies mainly in developed countries such as the United States, France, and Japan.
The demand in North America is projected to witness significant growth
Increasing military spending and an extensive rise in the demand for advanced and specialized aircraft are key factors expected to drive the growth of the special mission aircraft market in the region over the forecast period. In addition, aerospace is one of the largest and major industries in the terms of exports in the region with a large number of value chain partners across Europe, Asia, and South America coupled with the intensive research and development activities undertaken in the aviation industry.
Furthermore, the Asia Pacific region is projected to grow rapidly throughout the forecast period owing to an increasing number of geopolitical issues and rising border tensions, especially in countries like India and China. In addition, undertaking several types of development activities and increasing focus on fleet modernization for enhancing aerial capabilities such as situational awareness and combat readiness are likely to propel the growth of the special mission aircraft market in the region over the coming years.
Competitive Insight
Key players include The Boeing Company, Lockheed Martin, Dassault Aviation SA, Textron Aviation Inc., Northrop Grumman Corporation, General Dynamics Corporation, Butler National Corporation, General Atomics Aeronautical Systems Inc., Israel Aerospace Industries Ltd., L Harris Technologies Inc., Ruag International Holding AG, Gulfstream Aerospace Corporation, Elbit Systems Ltd., Bombardier Inc., BAE Systems, and Pilatus Aircraft Ltd.
Recent Developments
In May 2025, Qatar finalized a USD 2 billion deal to procure MQ-9B Reaper drones.
In April 2025, Sweden placed an order for four Embraer C-390 Millennium transports at LAAD 2025.
In April 2024, Sierra Nevada Corporation secured a USD 13 billion contract for the Survivable Airborne Operations Center.
In November 2021, Norwegian Defense Material Agency announced the acceptance of its first 5 Boeing P 8A Poseidon patrolling aircraft “Vingtor”, manufactured & designed by the Boeing Company, to be operated by the Royal Norwegian Air Force.
In August 2021, Lockheed Martin was awarded USD 328.8 Mn, for the 5-year contract from the Indian Airforce, to provide comprehensive & dedicated support for IAF’s fleet of the 12 C 130J 30 Hercules Aircraft.
Report Scope
| Report Attributes | Details |
| Market size value in 2022 | USD 11.42 billion |
| Revenue forecast in 2030 | USD 16.14 billion |
| CAGR | 4.4% from 2022 – 2030 |
| Base year | 2021 |
| Historical data | 2018 – 2020 |
| Forecast period | 2022 – 2030 |
| Quantitative units | Revenue in USD billion and CAGR from 2022 to 2030 |
| Segments covered | By Platform, By Application, By End-User, By Region |
| Regional scope | North America, Europe, Asia Pacific, Latin America; Middle East & Africa |
| Key companies | The Boeing Company, Lockheed Martin, Dassault Aviation SA, Textron Aviation Inc., Northrop Grumman Corporation, General Dynamics Corporation, Butler National Corporation, General Atomics Aeronautical Systems Inc., Israel Aerospace Industries Ltd., L Harris Technologies Inc., Ruag International Holding AG, Gulfstream Aerospace Corporation, Elbit Systems Ltd., Bombardier Inc., BAE Systems, and Pilatus Aircraft Ltd. |
Research Methodology
A robust system of research, verification, and forecasting designed to ensure reliable and actionable market insights.
Polaris Market Research & Consulting, Inc. uses a clear and structured approach to deliver insights that clients can rely on. The process combines detailed primary and secondary research, including direct communication with industry experts. The detailed information helps build a complete picture of market trends and developments. Secondary data is gathered from credible sources such as industry reports, company filings, government source links, and trusted organization databases. It is then cross-checked through discussions with key stakeholders across the value chain. Market size and forecasts are developed using both bottom-up and top-down methods to ensure accuracy and consistency in the final results.
1. Project Setup
Step 1 & 2:
- We start every project by clearly understanding the client’s objective or goal, then defining the market scope, and aligning regions, segments, and timelines.
- Once the foundation is set, we collect data from all-around of sources, including company reports, government databases, and paid industry platforms.
- Our research is based on secondary data, which helps us build a strong understanding of the market across regions and industries. Then we validate this information through primary research by speaking directly with industry experts, companies, and stakeholders.
- By combining secondary and primary research, we ensure that our market insights are accurate, practical, and closely aligned with real market conditions.
2. Data Collection
We gather information from both public and verified sources:
3. Data Structuring
Step 3:
- All collected data is organized into a consistent format to ensure accurate analysis. Since inputs come from multiple sources, they are standardized and aligned before use.
- The data is segmented by product, application, and region, and mapped across a defined historical period (2020–2024). All values are converted into common units (USD Mn/Bn), and volume and pricing are aligned where required to estimate revenue.
- Any overlaps or inconsistencies are reviewed and adjusted to maintain accuracy (<5% variance threshold).
- The result is a structured dataset that allows for clear comparison across regions and supports reliable analysis and forecasting.
Structured Market Dataset, USD Mn/Bn
| Region | Segment | VolumeUnits | Avg PriceUSD | RevenueUSD Mn | Share % |
|---|---|---|---|---|---|
| North America | Product A | 250 | 2.5 | 500 | 15% |
| Product A | XX | XX | XX | XX | |
| Product A | XX | XX | XX | XX | |
| Consistent methodology applied across regions | |||||
4. Market Estimation
Step 4: TOP-DOWN APPROACH
- We start with the overall market size at a global or macro level.
- The market is then narrowed down based on scope and industry relevance.
- We apply penetration rates and split the data by region and segment.
- This helps us estimate the market size for specific segments.
- The numbers are validated through cross-checks to ensure accuracy.
Step 5: BOTTOM-UP APPROACH
- We begin by analyzing data from leading companies in the market.
- Revenue data is collected and mapped across different segments.
- The data is then aggregated to estimate the total market size.
- To fill in any gaps, adjustments are made based on industry standards.
- Validation checks make sure that the results are correct.
5. Forecasting
Step 6:
At Polaris Market Research & Consulting, Inc., we employ a methodical forecasting strategy. This approach blends the analysis of historical data with real-time market validation. To forecast future trends with precision, we examine past patterns, pricing fluctuations, and the interplay of supply and demand. To ensure our conclusions reflect the present market landscape, we actively seek input from industry experts and key stakeholders.
To refine our predictions, we carefully consider critical elements such as market drivers and restraints, fluctuations in raw material costs, emerging technologies, and the production capabilities of various regions. Furthermore, we assess regulatory frameworks and potential policy shifts to gauge their potential impact on market expansion.
All this information is synthesized to generate precise forecasts for each segment and region. These forecasts illuminate the current state of the market and highlight forthcoming opportunities.
6. Validation & Triangulation
Step 7:
In the final stage, we validate all our estimates using a triangulation method, where data is cross-checked from multiple reliable sources, like company data, primary interviews, and secondary research. This helps us make sure that our numbers are correct and fit with the rest of the market.
This process involves verifying data consistency across various segments and geographic areas. It also requires comparing historical trends with the assumptions support the forecast. Any discrepancies involve adjustments to ensure everything remains aligned and dependable.
Once the data is finalized, we prepare the final outputs, including market size estimates, segment-wise breakdowns, and growth metrics. These are delivered in structured formats such as tables, charts, and data files for easy analysis and use.
We collaborate closely with clients, ensuring the final products align with their requirements. This includes offering tailored adjustments, supplementary data analyses, and continuous assistance. Furthermore, we monitor market trends post-delivery, providing updates and refinements to maintain the insights' relevance as time passes.
Triangulation Framework
Estimates are cross-verified across three sources:
Company-level data
• Primary inputs from industry participants
• Secondary benchmarks and published data
Variance maintained within +5-10%
Adjustments applied to align estimates
Segment values validated against overall market structure
Data Consistency & Integrity
Segment totals validated to 100%
Regional estimates aligned with global market size
Historical trends compared against forecast outputs
Assumptions reviewed for cross-segment and regional alignment
Final Outputs
Deliverables
Client Alignment & Support
- Deliverables are aligned with defined client requirements and scope
- Custom data cuts and segment splits are incorporated as required
- Post-delivery queries are addressed through analyst interactions
- Additional clarifications and data support are provided upon request
Client Continuity & Updates
- Market developments are tracked post-delivery to capture changes in key trends
- Updated data and revisions are provided based on new market inputs
- Additional refinements and data cuts are shared as required
- Continued analyst engagement supports evolving client requirements
Download Sample Report of Special Mission Aircraft Market
Please fill out the form to request a customized copy of the research report.
